
Single-sequence protein-RNA complex structure prediction by geometric attention-enabled pairing of biological language models
Link: full article
Authors: Rahmatullah Roche, Sumit Tarafder, Debswapna Bhattacharya
Cell Systems, October 15, 2025
On this page
The structures of protein-RNA complexes underpin the molecular mechanisms of transcriptional regulation, RNA splicing, ribosome assembly, viral replication and more, yet far fewer protein-RNA complexes have been solved experimentally than protein-protein complexes. Methods such as AlphaFold 3, RF2NA and RF2AA can predict complex structures, but they usually rely on multiple sequence alignments (MSAs) to capture coevolutionary signals. The problem is that paired protein-RNA MSAs are generally scarce in practice: among the 39 test targets in this paper, 28 have a paired MSA depth of only 1, meaning the alignment contains just the query sequence itself, with no additional homologous sequences.
Debswapna Bhattacharya’s team at Virginia Tech proposes ProRNA3D-single: by geometry-aware pairing of a protein language model (ESM-2, 650 million parameters) and an RNA language model (RNA-FM, 99 million parameters), it predicts the 3D structures of protein-RNA complexes without using any MSAs or templates. The core strategy is to first predict an inter-molecular Cα-C4′ distance map and then convert the distance restraints into 3D coordinates through PyRosetta geometry optimization.
On the Test_39 test set, ProRNA3D-single achieves a successful prediction rate (fnat > 0.2) of 41.03% (16/39), about 18 percentage points higher than AlphaFold 3 and about 26 percentage points higher than both RF2NA and RF2AA. Even more striking: once MSAs and templates are removed from RF2NA (RF2NA-single), not a single one of the 39 targets reaches the success criterion.
Part 1: Research Question
Protein-RNA complex structure prediction faces two key bottlenecks. First, known high-resolution protein-RNA complex structures are very limited: the PDB holds only about one tenth as many protein-RNA complexes as protein-protein complexes, so training data are inherently scarce. Second, joint/paired protein-RNA MSAs are harder to obtain than paired protein-protein MSAs: RNA sequence databases lag far behind protein sequence databases in size and diversity (Rfam has roughly one tenth as many families as Pfam), and many protein-RNA interactions leave no clear coevolutionary imprint, so MSA-based methods are inherently limited in this setting.
RF2NA was the representative method dedicated to protein-nucleic acid complex prediction at the time (when the paper was submitted in July 2024), but its performance collapses in the RF2NA-single version without MSAs and templates: all 39 targets fall below the fnat > 0.2 success line. This shows that simply removing the MSA input and keeping only the single sequence does not solve single-sequence prediction; the architecture for information extraction and interface modeling must be redesigned around language-model embeddings.
The central question of ProRNA3D-single is: can protein and RNA language models be effectively paired so that the biological knowledge they accumulated during large-scale sequence pretraining is used to predict the 3D structure of protein-RNA complex interfaces directly, without explicit paired MSAs?
There is a subtle logic here: protein language models (such as ESM-2) and RNA language models (such as RNA-FM) are each pretrained on large-scale single-molecule sequences and learn sequence-structure relationships within their own molecule type; they have never been explicitly trained on how proteins and RNAs interact. ProRNA3D-single bets that the biological knowledge accumulated separately by these two kinds of models, when paired in a suitably geometric way (E(3)-equivariant graph networks + triangle attention), is enough to infer distance relationships across the inter-molecular interface.
Part 2: Methodology: Pairing two language models + distance maps + PyRosetta reconstruction
Dual language-model embeddings and structure graph construction
The protein sequence is fed into ESM-2 (650 million parameters), producing a 1280-dimensional embedding vector per residue; the RNA sequence is fed into RNA-FM (99 million parameters), producing a 640-dimensional embedding vector per nucleotide. In parallel, the protein monomer structure (Cα coordinates) is predicted with ESMFold and the RNA monomer structure (C4′ coordinates) with E2Efold-3D. The embeddings are then placed into graphs whose nodes are defined by the 3D coordinates: the protein graph uses Cα atoms as nodes with a 14 Å neighbor threshold, and the RNA graph uses C4′ atoms as nodes with a 20 Å neighbor threshold (RNA backbone spacing is larger, hence the wider threshold). Each graph passes through a 4-layer E(3)-equivariant graph neural network (EGNN, hidden dimension 128), which fuses sequence embeddings with spatial information while preserving rotational and translational equivariance. Finally, protein node features and RNA node features are paired exhaustively to form an Lp × Lr pairwise representation matrix.
Distance distribution prediction
The pairwise matrix is processed by 20 ResNet-Inception blocks, each containing three kernel shapes, 1×9, 3×3 and 9×1, which capture interface patterns at different scales along the RNA direction, within local 2D regions, and along the protein direction, respectively. Next, 20 triangle-aware geometric attention blocks introduce many-body constraints: if residue i is close to nucleotide j, and nucleotide j has a definite distance relationship with nucleotide k, then the predicted i-j and i-k distances must not contradict each other. The final output is a probability distribution over 37 distance bins (2.5-20 Å) for the predicted distance of every Cα-C4′ pair.
PyRosetta geometry optimization
The predicted distance distributions are converted into BOUNDED AtomPair constraints at 10 different weight scales. Starting from the predicted monomer structures, the FastRelax protocol iteratively optimizes the relative position and orientation of the protein and RNA under these constraints. The distance constraints are applied simultaneously in global space, so the distance predictions for all residue-nucleotide pairs jointly determine the final 3D configuration.
Part 3: Key Figure Analysis
Figure 1: Method workflow
What this figure asks: How are the embeddings from the two language models paired with the monomer structures to ultimately predict an inter-molecular distance map?
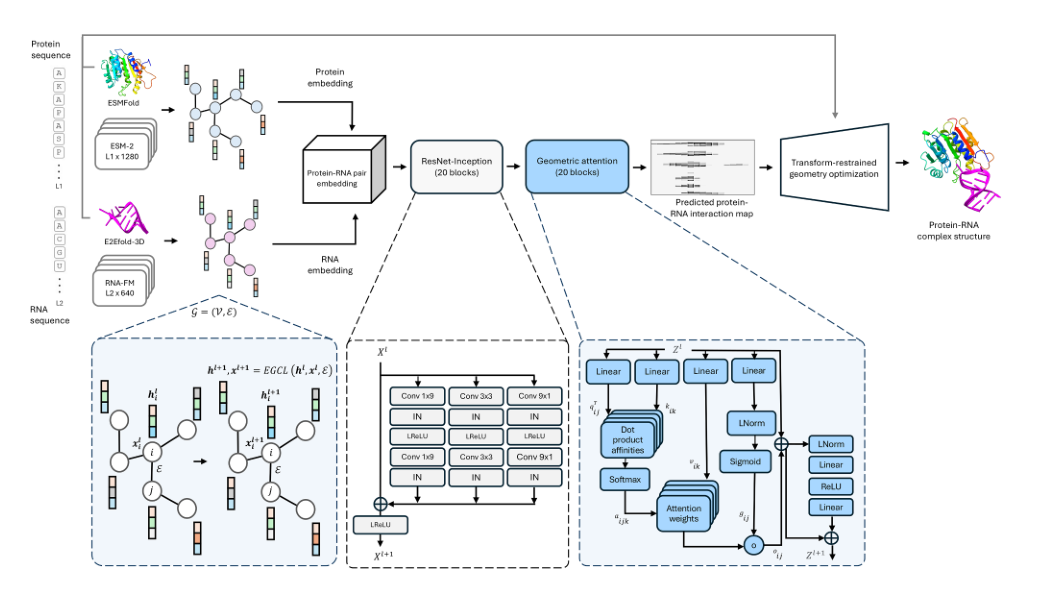
Figure 1. The ProRNA3D-single workflow. The protein and RNA each pass through a language model and a monomer predictor to obtain embeddings and coordinates; structure-aware graphs are built and paired via E(3)-equivariant graph convolutions; ResNet-Inception and geometric attention then predict the inter-molecular distance map, and PyRosetta finally optimizes the complex.
Input: the protein sequence goes through ESM-2 (1280-dimensional embeddings) + ESMFold (Cα coordinates), and the RNA through RNA-FM (640-dimensional embeddings) + E2Efold-3D (C4′ coordinates). The key is to use sequence semantics and spatial geometry at the same time.
Processing → output: each passes through a 4-layer E(3)-equivariant graph network; protein nodes and RNA nodes are paired exhaustively into an Lp×Lr matrix; ResNet-Inception and triangle geometric attention then predict the probability that each Cα-C4′ pair falls into each of 37 distance bins; finally PyRosetta converts this into 3D coordinates. Unlike AF3’s end-to-end design, it splits the problem into three stages: monomer modeling, distance prediction and coordinate reconstruction, each of which can be validated independently.
Figure 2: Overall performance on Test_39
What this figure asks: Without MSAs, how does ProRNA3D-single compare with AF3, RF2NA and RF2AA, which use MSAs?
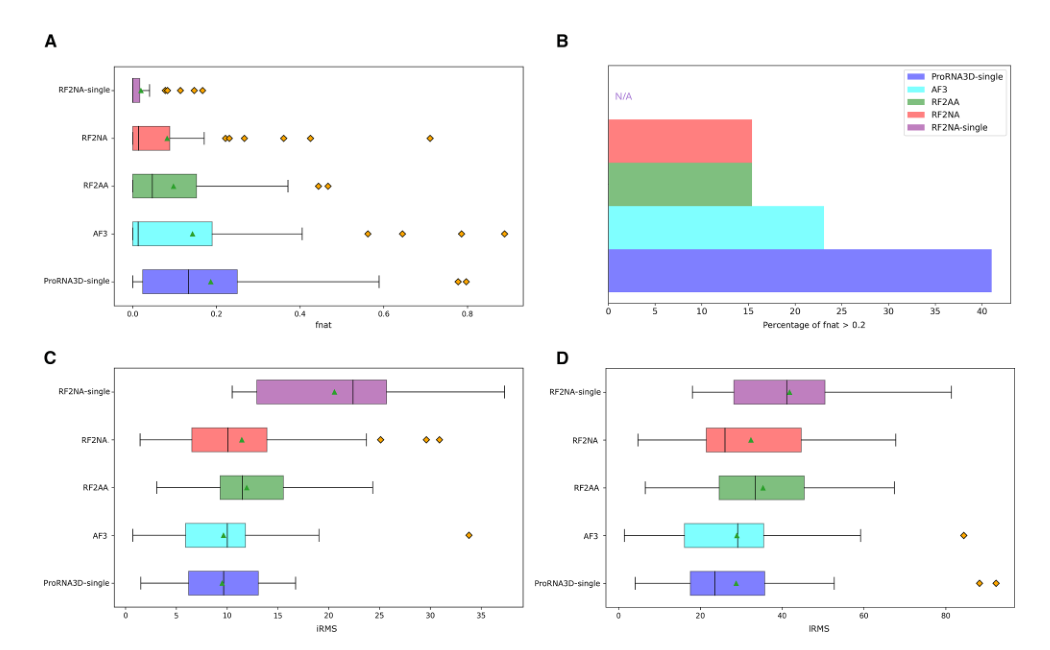
Figure 2. Overall comparison on Test_39. (A) fnat distributions. (B) Success rate at fnat > 0.2. (C) iRMS. (D) lRMS. ProRNA3D-single (purple) is best overall.
fnat measures whether interface contacts are predicted correctly. Panel B: success rates (fnat > 0.2) are 41.03% for ProRNA3D-single, about 23% for AF3, about 15% for RF2NA/RF2AA, and 0% for RF2NA-single (MSA removed). The last one collapses entirely, showing that ‘removing the MSA without changing the architecture’ does not work. On the two complementary metrics iRMS and lRMS, ProRNA3D-single also has the lowest median. The best case, 7W9S (an enterovirus complex), reaches fnat 0.778, while on the failure case 8F5G (a β-rich protein) every method scores 0.
Figure 3: Two representative cases
What this figure asks: On specific complexes, how well do the structures predicted by each method match the experimental structures?
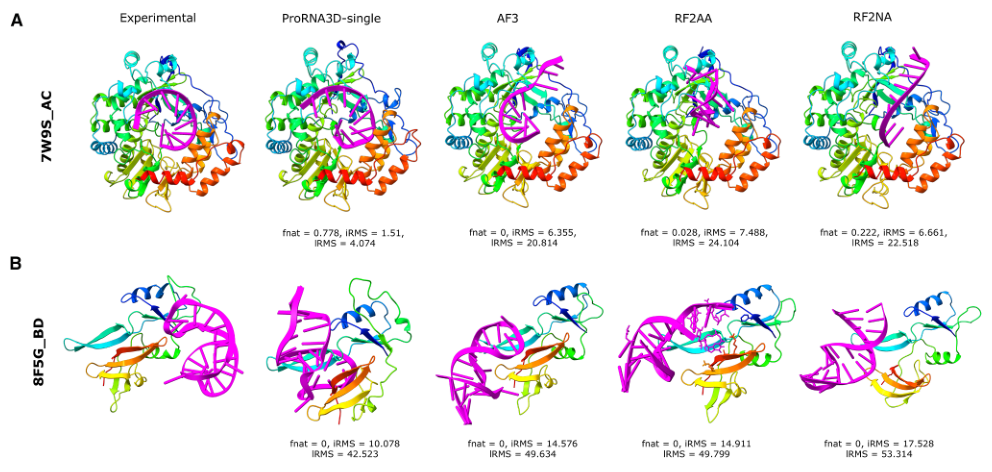
Figure 3. Predicted structures from ProRNA3D-single, AF3, RF2AA and RF2NA on two representative cases (7W9S_AC, 8FSG_BD), annotated with their fnat / iRMS / lRMS.
The leftmost column is the experimental structure and the four columns to the right are the methods. On 7W9S_AC, ProRNA3D-single achieves fnat 0.778 and iRMS 1.51 Å, with the RNA (magenta) essentially overlapping its experimental position, whereas the RNA from AF3/RF2AA/RF2NA is clearly misplaced (fnat 0–0.22). 8FSG_BD is a recognized hard case: all four methods score fnat 0 and place the RNA entirely wrong, because β-rich folds like this are too rare in the training data.
Figure 4: The advantage is largest when there is no MSA
What this figure asks: How does the depth of the paired MSA affect each method’s performance?
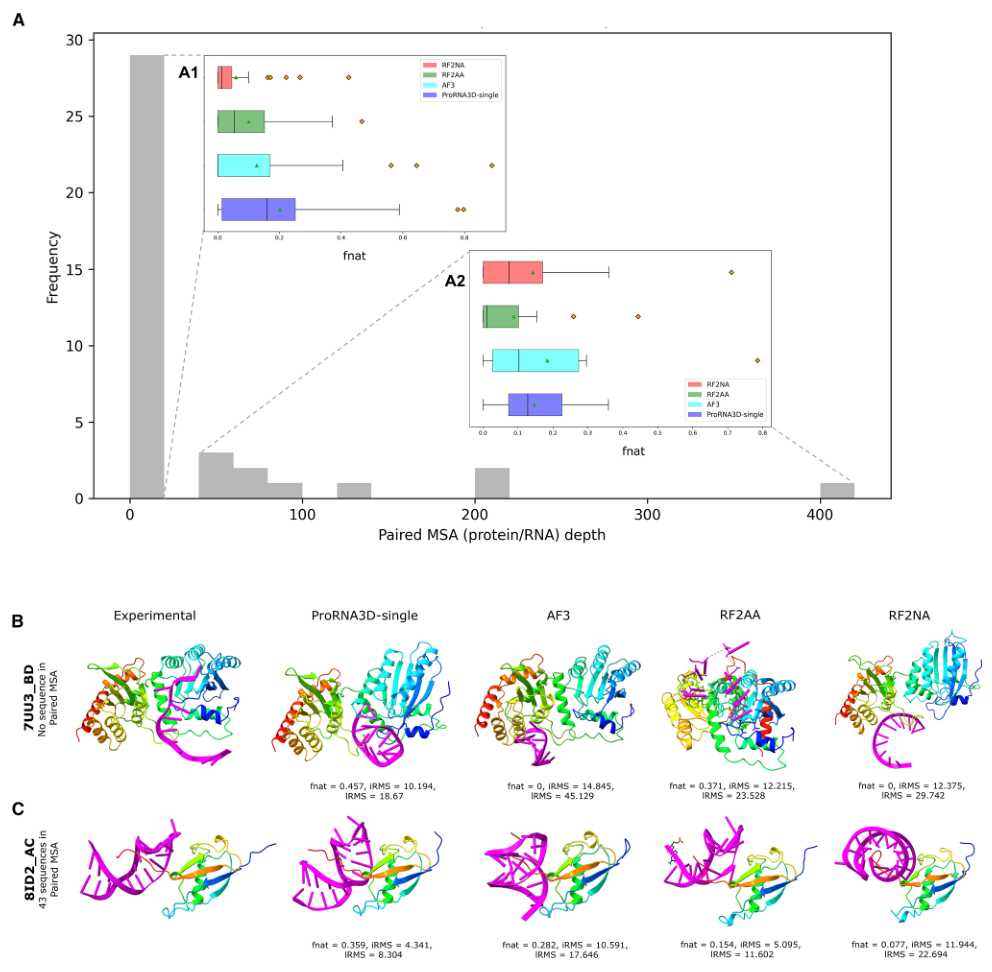
Figure 4. Effect of evolutionary information on prediction. (A) Distribution of paired MSA depth in the test set and fnat grouped by depth. (B–C) Representative cases with no paired homologous sequences.
- Panel A: among the 39 targets, 28 have a paired MSA depth of only 1 (just the query sequence itself). On these targets without coevolutionary signal, the fnat box of ProRNA3D-single (blue) sits clearly above those of the MSA-dependent methods; for example, on 7UU3 it reaches fnat 0.5, while AF3 and RF2NA reach only 0.043. On the 11 targets with MSA depth > 1, AF3 leverages its MSAs to perform best overall, and ProRNA3D-single still ranks second.
Figure 5: Distance-map accuracy determines structure quality
What this figure asks: How accurate is the intermediate distance-map prediction, and how strongly does it relate to the final complex quality?
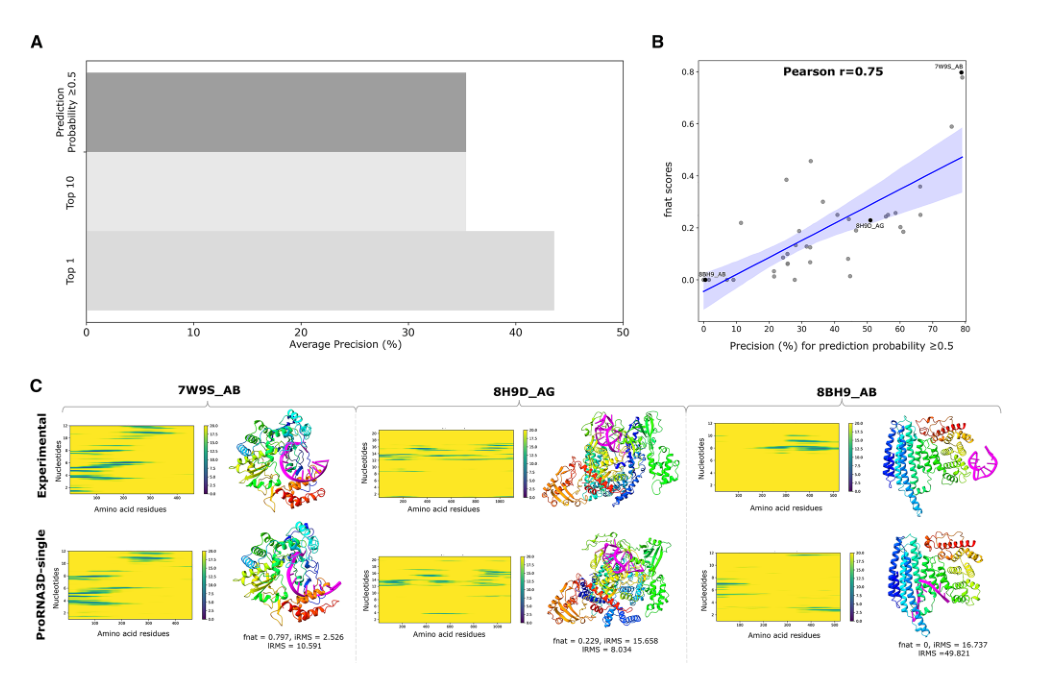
Figure 5. Relationship between predicted distance-map accuracy and complex quality. (A) Precision at different confidence thresholds. (B) Correlation between distance-map precision and fnat (Pearson r = 0.75). (C) Distance maps and structures for three representative cases.
- Panel A: taking the Top-K contacts by confidence, Top-1 precision is 43.59% and Top-10 is 35.39%, so the model’s most confident predictions are indeed more reliable. Panel B: distance-map precision correlates with final fnat at Pearson r = 0.75. When the distance map is accurate, PyRosetta can reconstruct a good structure; when it is wrong, physical optimization cannot rescue it. This validates the staged design of ‘learn a good distance map first, then reconstruct with a physics engine’. Panel C lays out the cause of failure clearly: when the contact band in the distance map is shifted, the RNA ends up placed in the wrong orientation in 3D space.
Figure 6: Comparison on another set of metrics
What this figure asks: Switching to metrics such as monomer TM-score and interface fnat, where does each method’s strength lie?
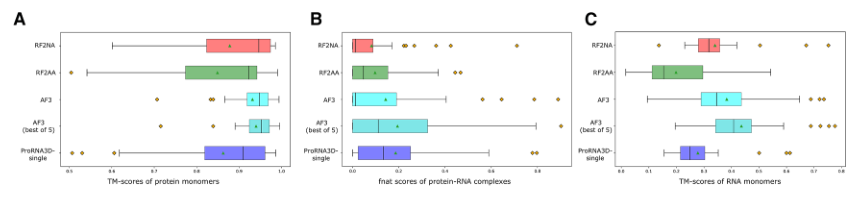
Figure 6. Comparison across methods. (A) Protein monomer TM-score. (B) Protein-RNA complex fnat. (C) RNA monomer TM-score.
This figure highlights a key contrast: AF3/RF2NA usually predict monomer structures (A, C) more accurately than ProRNA3D-single, yet their complex-interface fnat (B) is lower. This suggests that complex prediction actually consists of two relatively independent subproblems: whether the components are folded correctly, and whether they are bound to each other correctly. ProRNA3D-single’s strength lies precisely in the latter; end-to-end methods may weight the monomer loss too heavily and the interface too lightly.
Figure 7: Ablations: every module is indispensable
What this figure asks: Among graph embedding, equivariance and geometric attention, which one costs the most when removed?
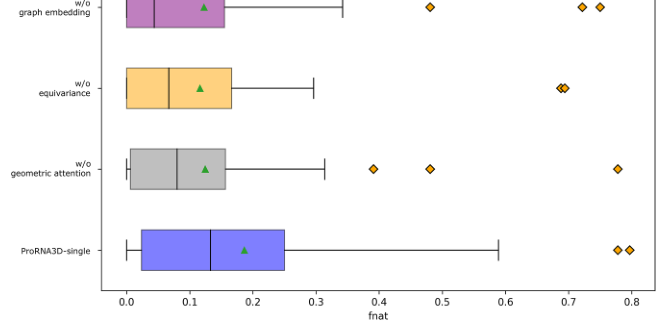
Figure 7. Ablation study. Distributions of fnat for the full model versus variants without graph embedding, equivariance or geometric attention.
The full model has a mean fnat of 0.186. Removing geometric attention lowers it to 0.125 (−33%), removing E(3) equivariance to 0.116 (−38%), and removing graph embedding to 0.123 (−34%). The three drops are similar in size, showing that ‘structured use of language-model embeddings (graph embedding + equivariance)’ and ‘geometric consistency in distance prediction (geometric attention)’ are equally critical and none can be dropped.
Part 4: Key Contributions
ProRNA3D-single answers an important question: where is the bottleneck in protein-RNA complex prediction? The answer has three layers. First, interface prediction is the core difficulty: accurate monomer folding does not guarantee an accurate complex, and a method that specifically learns the inter-molecular interface has the edge on this ultimate goal. Second, in the absence of paired MSAs, protein and RNA language models, suitably organized through structure-aware graph embeddings and geometric attention, can serve as an effective substitute for coevolutionary signals. Third, an explicit atom-pair distance map is a key intermediate representation linking deep-learning prediction to 3D physical modeling: every predicted distance has a clear physical meaning (the spatial distance between Cα and C4′) and can be compared directly with experimental data, which makes it easier to interpret and debug and also makes it convenient to incorporate experimental constraints in the future (such as inter-residue distance upper bounds from cross-linking mass spectrometry, or RNA structural constraints from SHAPE chemical probing) to further improve accuracy.
In terms of training efficiency, ProRNA3D-single needs only about 3.5 days on a single A100 GPU to train, far less than AF3’s roughly 20 days on about 256 A100s, which means academic labs can train and improve this method within a reasonable compute budget. More broadly, ProRNA3D-single demonstrates a technical route of ‘replacing scarce coevolutionary data with pretrained language models, and replacing giant end-to-end models with modular geometric deep learning’. As experimental data on protein-RNA complexes accumulate and language models scale up, this paradigm of pairing two language models with geometric modeling could prove useful in more prediction tasks involving inter-molecular interactions, such as protein-DNA complexes, RNA-RNA interactions, and the binding modes of proteins with small RNAs (such as miRNAs and siRNAs), all of which likewise face a shortage of paired MSAs.
Part 5: Limitations and Outlook
The size of Test_39 (39 complexes) limits the reliability of statistical inference, so the conclusions should be generalized with caution. Absolute accuracy still has room to improve: a 41.03% success rate means that nearly 59% of targets fall short of fnat > 0.2, and the mean fnat is only 0.186. β-rich protein-RNA complexes are severely underrepresented in the training data, causing interface prediction for this class of structures to fail across the board (every method scores fnat 0 on PDB 8F5G). This suggests that the protein-RNA prediction field needs more training data covering diverse protein fold types, and the current number of PDB entries alone may not be enough. The method is a chain of several independent modules (ESMFold, E2Efold-3D, ESM-2, RNA-FM, EGNN, the distance-prediction network, PyRosetta), so errors propagate from module to module and cannot be optimized jointly through end-to-end training.
On fairness, if the AF3 model closest to the true structure were selected after the fact from AF3’s five output models (oracle selection), AF3’s fnat would be better than ProRNA3D-single’s. But in real prediction one does not know which model is best, and this paper compares against AF3’s default top-ranked model. In addition, ProRNA3D-single predicts the relative position of the protein and the RNA and depends on the quality of the monomer structure predictions: when the monomer structures from ESMFold or E2Efold-3D are themselves substantially wrong, the spatial information received by the graph neural network is inaccurate, and this error propagates to the final interface distance map. After analyzing the relationship between monomer TM-score and complex fnat, the authors found no strong correlation between the two. From another angle, this shows that the current method is somewhat robust to monomer errors, but systematic monomer prediction failures (for example, on certain atypical RNA folds) remain a bottleneck.
About the Corresponding Author
Debswapna Bhattacharya is the corresponding author of this paper, affiliated with the Department of Computer Science at Virginia Tech (Virginia Tech). He received his bachelor’s degree from Jadavpur University (Jadavpur University) in India, earned his Ph.D. from Iowa State University, and subsequently conducted postdoctoral research in the David Baker laboratory at the University of Washington. His research team has long focused on computational structural biology, particularly the development of methods for predicting three-dimensional structures of proteins and protein-nucleic acid complexes. Previously, he published the ProRNA3D series (the initial version used MSA input, and the single version in this paper is an MSA-free extension) and DeepComplex, continuously exploring how to predict three-dimensional structures of biomolecular complexes from sequence information using deep learning methods. Rahmatullah Roche, the first author of this paper, is a Ph.D. student in Bhattacharya’s laboratory and also a principal developer of the ProRNA3D series.
Citation
Roche, R., Tarafder, S., & Bhattacharya, D. (2025). Single-sequence protein-RNA complex structure prediction by geometric attention-enabled pairing of biological language models. Cell Systems, 16, 101400. https://doi.org/10.1016/j.cels.2025.101400