
AlloBench: A Data Set Pipeline for the Development and Benchmarking of Allosteric Site Prediction Tools
Link: full article
Authors: Dibyajyoti Maity, Baofu Qiao
ACS Omega, May 6, 2025
On this page
Overview
Allosteric regulation is an important targeting strategy in drug design, but existing allosteric site datasets are outdated, small or incomplete, and the various prediction tools have never been compared fairly on the same test set. This paper presents AlloBench, a dataset construction pipeline that can be continuously updated. It integrates four databases (ASD, UniProt, M-CSA and PDB) and produces a high-quality dataset containing 2,141 allosteric sites. On a 100-protein test set purged of training-set leakage, the authors benchmarked 10 prediction tools under a single protocol and found that every tool’s accuracy is below 60%, with PASSer (Ensemble) performing best.
Part 1: Research Question
Allostery refers to the phenomenon in which an effector molecule binds to a site on a protein far from the active site (the allosteric site) and thereby changes the protein’s activity. Compared with orthosteric drugs that directly occupy the active site, allosteric drugs usually offer higher target selectivity and fewer side effects, and they can either enhance or inhibit protein activity. Computational prediction of allosteric sites is therefore an important frontier in drug discovery.
Existing datasets, however, each have their limitations. ASD (AlloSteric Database), 2023 edition, contains 3,102 allosteric sites and is relatively large, but the authors found that in its downloadable table file, 1,620 records (more than half) lack allosteric site residue information; it also contains obsolete PDB/UniProt IDs and inconsistent mappings between databases, so it cannot be used directly for machine learning. ASBench, published in 2015, contains only 202 unique proteins, does not include discoveries from the past decade and provides no systematic active site information. CASBench annotates 2,870 structures, but they come from only 91 unique proteins, so multiple structures of the same protein cause severe redundancy.
More importantly, the prediction tools each use different test sets and evaluation criteria, so their performance cannot be compared fairly. A high accuracy reported in a tool’s paper may simply reflect a small test set or homologous-protein leakage from the training set: if the training and test sets contain proteins with high sequence homology, the model may merely be ‘memorizing’ known sites rather than genuinely learning to predict allosteric sites in new proteins. No one had previously compared all mainstream tools on a unified test set that had been rigorously cleaned of leakage; Table 1 lists the differences in training data, methods and evaluation used by each of these tools. These are the two core problems AlloBench sets out to solve: dataset quality and evaluation fairness.
Part 2: Methodology: Building the AlloBench pipeline
The central design idea of AlloBench is that, rather than releasing yet another static dataset that will eventually become outdated, it is better to provide a pipeline that can be rerun and upgraded continuously. The pipeline starts from four data sources and goes through several cleaning and quality-control steps:
Step 1: Extraction and cleaning. Because the ASD table file has so many missing values, the authors instead parsed ASD’s XML files to extract allosteric proteins, modulators and site residues. They then updated obsolete PDB IDs, removed structures not present in the PDB, re-retrieved UniProt mappings through the PDB GraphQL API and deleted records whose PDB and UniProt information contradicted each other. This step ensures that the basic information of ‘which protein does this structure actually correspond to’ is reliable.
Step 2: Adding active sites. Some prediction tools (such as Ohm and AlloPred) require the active site as a reference input, but ASD itself does not provide this information. The authors obtained active sites from two sources, UniProt and M-CSA, and used sequence alignment to convert UniProt numbering into the correct residue numbers in the PDB structure. This step is essential for handling N-terminal truncations, missing regions, indels and engineered mutations: residue 100 in UniProt might become residue 85 in the PDB structure because of truncation. Only proteins that have both an allosteric site and an active site were kept. This is also an important feature that distinguishes AlloBench from ASBench: it provides both allosteric sites and active sites.
Step 3: Structural quality control. Structures with resolution better than 4 Å were selected. Biological assemblies were used instead of crystallographic asymmetric units, because real proteins may be dimers, tetramers or higher-order complexes, and allosteric sites may lie at subunit interfaces; supplying only a single chain could make an interfacial allosteric site disappear, or cause a surface that is normally covered by another subunit to be misidentified as a pocket. Multiple models within the same PDB entry were merged (613 PDB files contain multiple models). Missing residues were modeled and filled in with ProMod3 (1,291 of the 2,034 structures had missing residues), and structures with modeling quality lDDT < 0.8 were removed. Missing residues may form part of an allosteric pocket or participate in long-range signal propagation, so filling them in is especially important for tools that rely on dynamics analysis.
Step 4: Redefining sites. The authors did not copy ASD’s site annotations wholesale; instead, they verified them using the allosteric modulators actually present in the PDB structures, defining the allosteric site in a structure as the protein residues within ≤ 4 Å of the modulator. This uniform, structure-based distance definition ensures that the site standard is consistent across proteins.
Part 3: Key Figure Analysis
Figure 1: Overlap among three allosteric databases
What this figure asks: Do the three existing databases, ASD, ASBench and CASBench, actually overlap in proteins, and how large is each?
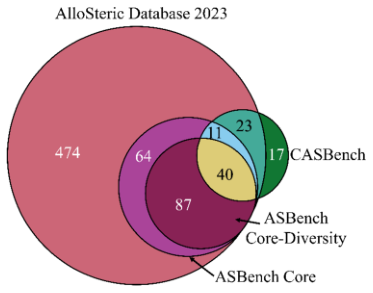
Figure 1. Venn diagram of the unique protein chains (UniProt accessions) in each database. ASD 2023 contains 699 proteins, the ASBench Core and Core-Diversity sets contain 202 and 127, respectively, and CASBench contains 91.
The largest pink circle in the figure is ASD 2023, which alone holds 474 unique proteins, far more than the other databases. ASBench Core (purple), Core-Diversity (dark red) and CASBench (green) are all much smaller and also overlap heavily with one another.
The figure makes two points: ASD has the broadest coverage and is the most valuable source to mine; but the databases are clearly redundant with one another, and merging them directly would double-count. AlloBench therefore chose to rebuild from ASD rather than simply concatenate the databases.
Figure 2: Prediction tools fall into three methodological families
What this figure asks: Which distinct approaches actually underlie the allosteric site prediction tools being benchmarked?
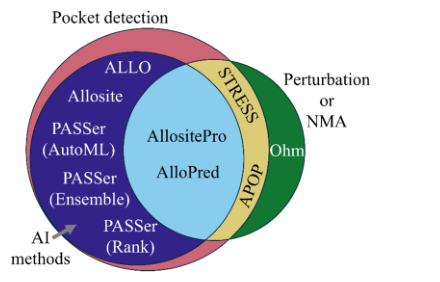
Figure 2. Venn diagram of the methods used by each allosteric site prediction tool. Pocket-detection methods first find surface pockets and then decide whether they are allosteric; AI methods train machine learning models on pocket features; perturbation methods mainly use normal mode analysis to assess how a pocket affects protein dynamics.
Pocket-detection methods (Allosite, the PASSer family and others) first use a tool such as Fpocket to find surface pockets and then decide which one is the allosteric site; AI methods (AllositePro, AlloPred) train classifiers on pocket features; perturbation methods (Ohm, STRESS) rely on normal modes or signal propagation analysis to see how perturbing a given location affects the protein’s overall dynamics.
The three circles overlap: many AI tools still need to perform pocket detection first, so they fall between two categories. Only Ohm is completely independent of pocket detection, a point that becomes crucial in the benchmark later on.
Figure 3: The AlloBench data pipeline
What this figure asks: Starting from four databases, how is a continuously upgradable benchmark cleaned step by step?
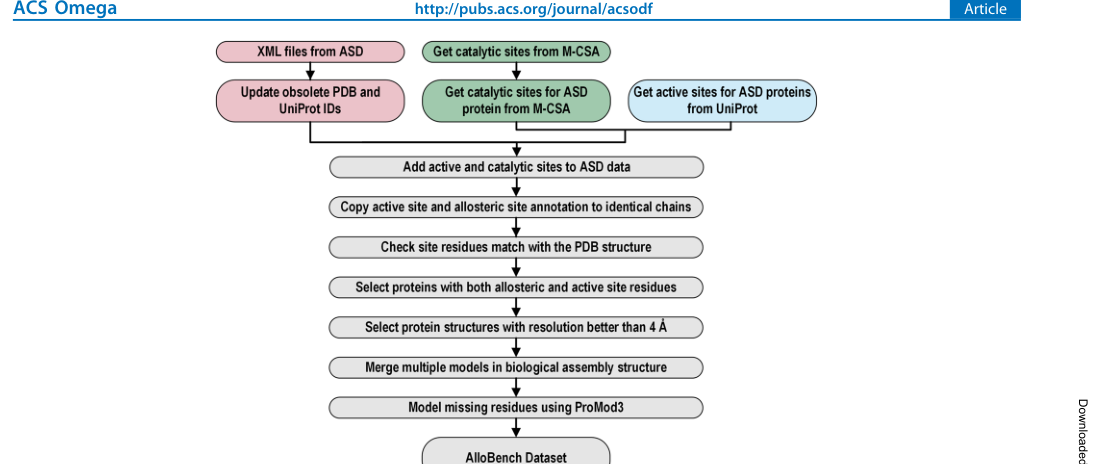
Figure 3. Schematic of each step of the AlloBench data pipeline.
Step 1, extraction and cleaning: the ASD table has severe missing values, so the XML is parsed instead to extract allosteric proteins, modulators and site residues; obsolete PDB IDs are updated, UniProt mappings are re-retrieved through the PDB GraphQL API, and self-contradictory records are deleted.
Step 2, adding active sites: active sites are obtained from UniProt and M-CSA, and sequence alignment converts UniProt numbering into the correct residue numbers in the PDB (handling truncations, deletions and mutations); only proteins with both an allosteric site and an active site are kept.
Step 3, structural quality control: structures with resolution better than 4 Å are kept; biological assemblies are used instead of asymmetric units (to avoid losing interfacial allosteric sites); multiple models are merged; and ProMod3 fills in missing residues, with structures of lDDT < 0.8 discarded.
Step 4, redefining sites: rather than copying ASD’s annotations, residues within ≤ 4 Å of the modulator in the PDB structure are taken as the allosteric site, ensuring a consistent site standard across proteins. The entire pipeline is implemented in Jupyter Notebooks, and users can change the filtering criteria and rerun it.
Figure 4: What the final dataset looks like
What this figure asks: How are the 2,141 allosteric sites distributed across species, function, modulator type and oligomeric state?
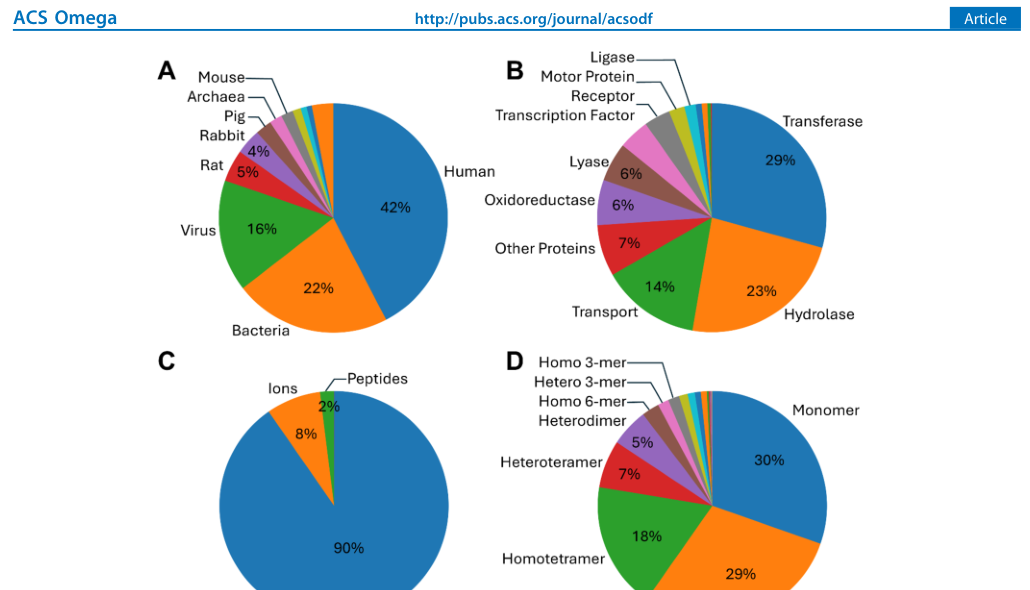
Figure 4. Distribution of proteins in AlloBench by (A) source organism, (B) function, (C) allosteric modulator type and (D) oligomeric state.
The final dataset contains 2,141 allosteric sites from 2,034 PDB structures and 418 unique UniProt chains, far exceeding ASBench (202) and CASBench (91) in both scale and diversity.
- Panel A, organism: 42% human, 22% bacterial and 16% viral. The high share of viral proteins reflects the importance of allosteric regulation in targeting viral enzymes such as HIV reverse transcriptase and HCV protease. Panel B, function: transferases (29%) and hydrolases (23%) are the most common.
- Panel C, modulators: 90% are small molecules, 8% ions and 2% peptides, consistent with the scope of most tools, which target only small-molecule pockets. Panel D, oligomeric state: homotrimers and monomers each account for about 30%, and 83% are homo-oligomers (including monomers). In 61 structures, the same PDB ID corresponds to 2 different modulators, showing that one protein can have multiple allosteric sites.
Figure 5: Distribution of the Jaccard index for ten tools
What this figure asks: On the leakage-free 100-protein test set, how well do each tool’s predicted sites overlap with the true sites?
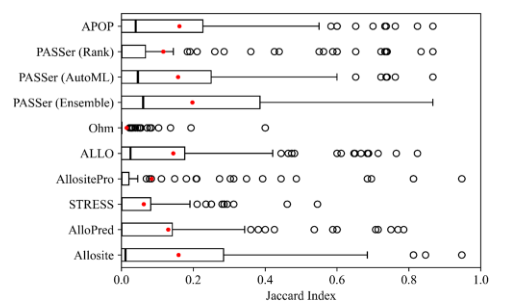
Figure 5. On the 100-protein test set, the distribution of the Jaccard index (JI = |known ∩ predicted| / |known ∪ predicted|) between each tool’s top-ranked predicted site and the known site.
JI directly measures the overlap between predicted residues and the true pocket: 0 means no overlap at all and 1 means a perfect match. In the results, PASSer (Ensemble) performs best, yet its median JI is only 0.060 (mean 0.197), followed by PASSer (AutoML, median 0.046), APOP (0.040), ALLO (0.025) and Allosite (0.011).
The remaining tools, AlloPred, PASSer (Rank), AllositePro, STRESS and Ohm, all have a median JI of 0: for more than half of the proteins they did not find the right site at all, and AllositePro failed to predict any site whatsoever for 35 proteins. Even for the best tool, the predicted residues overlap with the true site by only about 6% for most proteins.
Figure 6: Accuracy at different thresholds
What this figure asks: If a prediction must reach a certain JI threshold to count as correct, what fraction of proteins pass?
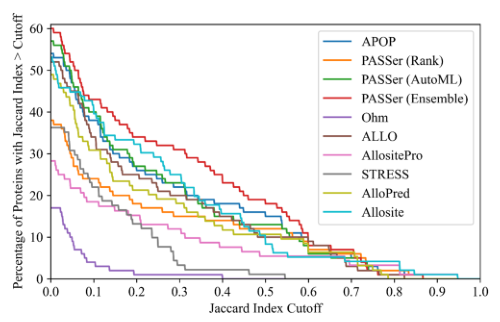
Figure 6. Percentage of the 100 proteins whose top-ranked predicted site has a JI above the given threshold (the horizontal axis is the JI threshold). Ohm does not rank its predictions, so its best prediction is used.
Each curve represents a tool, with the x-axis representing the JI threshold and the y-axis representing the proportion of proteins reaching that threshold. All tools have accuracy no higher than 60% when JI > 0.5, with most below 20%; when the threshold is increased to 0.6 or 0.8, the proportion drops sharply to zero.
Notably, Ohm does not rank predictions: in standard benchmarking, its median JI is 0 and mean 0.014; if taking the hotspot with the maximum JI among all its hotspots, the median JI rises to 0.129 and mean 0.164, indicating it can find hotspots near allosteric sites. Ohm is the only tool that completely does not rely on Fpocket, directly analyzing the propagation paths of perturbation signals—this suggests that dynamic information such as whether binding here can affect distant active sites is precisely what pure pocket detection lacks. The cost is that its predictions cover many residues with many false positives and cannot pinpoint a single pocket.
Figure 7: A side-by-side comparison on one protein
What this figure asks: When all tools’ predictions on the same protein are laid side by side, how visible are the differences?
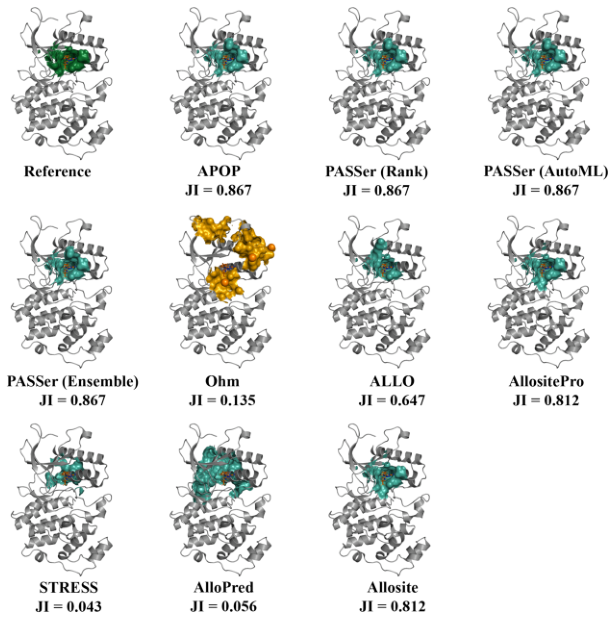
Figure 7. Each tool’s top-ranked predicted site on human mitogen-activated protein kinase 7 (PDB 4ZSG), with each JI given below. In the reference structure, the known allosteric site is dark green and predicted sites are green; Ohm’s hotspots are shown as orange spheres.
In the reference structure, dark green marks the true allosteric site. APOP and the three PASSer models all place their green predictions almost exactly on the same spot, with JI as high as 0.867; AllositePro and Allosite also reach 0.812.
By contrast, the predictions of STRESS (JI 0.043) and AlloPred (0.056) are clearly off target, while Ohm covers the screen with orange spheres (JI 0.135), confirming its weakness of spreading hotspots too widely and localizing poorly. This figure grounds the earlier statistical conclusions in an example that can be understood at a glance.
Part 4: Key Contributions
The authors built a 100-protein test set from AlloBench. The construction first identified the proteins in each prediction tool’s training data, including proteins from ASBench and CASBench; then, using UniRef50 cluster IDs, it excluded every protein in the test set that belonged to the same cluster as a training protein (that is, sequence identity below 50%), ensuring that the test set contains no proteins homologous to the training sets. In addition, only entries containing small-molecule allosteric modulators were kept (because the benchmarked tools mainly target small molecules). In the final set of 100 test proteins, only a minority contain monomeric structures, and most are oligomers. The benchmarked tools fall into three methodological families:
Pocket-detection methods: first identify pockets on the protein surface (most tools share Fpocket), then decide whether a pocket is an allosteric site; these include APOP and the three PASSer models (Ensemble/AutoML/Rank).
AI/machine learning methods: train classification models on pocket features; these include ALLO (naive Bayes + artificial neural network), Allosite and AllositePro (support vector machine/logistic regression) and AlloPred.
Perturbation analysis methods: use normal mode analysis or elastic network models to assess how a pocket affects protein dynamics; these include Ohm (a stochastic algorithm that analyzes perturbation propagation) and STRESS (normal mode analysis). Ohm is the only method that is completely independent of conventional pocket detection.
Prediction accuracy was evaluated with the Jaccard index (JI): the intersection of the known and predicted allosteric site residue sets divided by their union (JI = |K ∩ P| / |K ∪ P|), where 0 means no overlap at all and 1 means a perfect match. Because known sites are defined as the residues within ≤ 4 Å of the modulator, this metric directly measures how well the predicted residues coincide with the actual binding pocket. For each protein, only the highest-ranked predicted site was used to compute JI.
The results show that PASSer (Ensemble) performs the best, with a median JI of 0.060 and mean of 0.197—this means that even the best tool has only about 6% residue overlap between the predicted and true allosteric sites for more than half of the proteins. Next are PASSer (AutoML, median JI 0.046), APOP (median 0.040), ALLO (median 0.025), and Allosite (median 0.011). AlloPred, PASSer (Rank), AllositePro, STRESS, and Ohm all have a median JI of 0, meaning they found no allosteric sites at all for more than half of the test proteins and can only be ranked by mean JI: 0.130, 0.117, 0.084, 0.062, and 0.014. Particularly noteworthy is that AllositePro failed to predict any allosteric sites for 35 out of 100 test proteins.
Notably, Ohm: although it does not rank predicted sites (cannot select the “most likely” single site), its median JI is 0 in standard benchmarking; if taking the hotspot with the maximum JI among all its hotspots, the median JI rises to 0.129 and mean 0.164, indicating it can find hotspots near allosteric sites. Ohm is the only tool that does not depend at all on Fpocket pocket detection; it uses random algorithms to directly analyze the propagation paths of perturbation signals in proteins. This result suggests that perturbation propagation analysis may provide functional information lacking in pocket detection—it focuses on “whether binding here can affect distant active sites,” rather than merely “whether a molecule can bind here.” However, Ohm’s predictions typically cover many residues, cannot precisely pinpoint a single pocket, and produce many false positives.
If only each tool’s top-ranked predicted site is considered and accuracy is tallied at different JI thresholds, no program exceeds 60% accuracy at JI > 0.5, and most fall below 20%. At higher thresholds (JI > 0.6 or 0.8), accuracy drops even more sharply. In addition, there are 35 test proteins that no tool can predict correctly.
These results highlight that allosteric site prediction is far from solved. The authors point out that an ideal allosteric site prediction method should answer two questions at once: can a modulator bind here (pocket geometry)? And can binding here affect a distant active site (dynamic propagation)? Most current tools focus on the first question, while Ohm’s relatively good performance suggests that information about the second question is just as critical. Substantially improving prediction accuracy may require deeply integrating pocket geometric features, the protein’s overall 3D structure, machine learning methods and molecular dynamics analysis.
Running speed varies enormously across tools. Most pocket-detection and AI tools finish a prediction within seconds to minutes, but AlloPred and STRESS can take hours or even longer on large proteins because they depend on computationally intensive normal mode analysis (NMA). Since large-scale virtual screening and high-throughput analyses typically involve thousands of protein structures, running speed is also a practical factor that cannot be ignored when choosing a tool. The authors also compared specific protein cases: taking human mitogen-activated protein kinase 7 as an example, the top-ranked predicted sites of APOP and the three PASSer models all overlap closely with the known allosteric site, whereas the predictions of AlloPred and STRESS deviate substantially.
Part 5: Limitations and Outlook
AlloBench relies mainly on ASD’s manual annotations as its data source and therefore inherits ASD’s coverage and annotation biases; for example, the distribution of protein functional classes in ASD may reflect research popularity rather than the true distribution of allosteric proteins in nature. The pipeline currently does not distinguish the sites of allosteric activators from those of inhibitors, nor does it include information on the dynamic mechanisms of allosteric regulation (such as signal propagation paths). The test set has only 100 proteins, and some tools (such as Allosite and AllositePro) offer only web servers without an API and require manual submission, which limits the reproducibility and standardization of large-scale benchmarking. This is also the main reason the tools were not benchmarked exhaustively on all 2,034 structures.
The JI metric requires predicted sites to match annotated residues exactly, which may be overly strict when a prediction is spatially close but its residue numbering is slightly off. The authors also analyzed the correlation between JI and the distance between site centers and found a strong correlation, indicating that JI does reliably reflect the spatial proximity of predicted and true sites. In addition, most tools share Fpocket for pocket detection; if Fpocket fails to find the true allosteric site in the first step, the downstream classification models cannot recover it. The authors found that some tools (the three PASSer models) occasionally return spurious residue numbers near the correct residues (Supporting Information Table S3), possibly because of the way Fpocket enumerates pockets.
About the Corresponding Author
Baofu Qiao, the corresponding author, is affiliated with the Department of Natural Sciences at Baruch College, CUNY. He received his Bachelor’s degree from the University of Science and Technology of China, his Ph.D. from the Institute of Chemistry, Chinese Academy of Sciences, and subsequently conducted postdoctoral research at Northwestern University and Argonne National Laboratory. His research interests span computational chemistry and biophysics, focusing on molecular dynamics simulations, protein allosteric regulatory mechanisms, and the development of data-driven approaches for molecular design. The AlloBench pipeline code and generated datasets have been open-sourced on GitHub, and users can rerun the pipeline as needed to incorporate the latest discovered allosteric proteins. The first author Dibyajyoti Maity is also in the Department of Natural Sciences at Baruch College.
Citation
Maity, D., & Qiao, B. (2025). AlloBench: A Data Set Pipeline for the Development and Benchmarking of Allosteric Site Prediction Tools. ACS Omega, 10(17), 17973-17982. https://doi.org/10.1021/acsomega.5c01263