
Uncovering the Dominant Motion Modes of Allosteric Regulation Improves Allosteric Site Prediction
Link: full article
Authors: Juan Xie, Shiwei Wang, Youjun Xu, Minghua Deng, Luhua Lai
Journal of Chemical Information and Modeling, January 10, 2022
On this page
In brief
Allosteric drug design depends on locating allosteric sites accurately, yet existing methods tend to lump all of a protein’s motion modes together and overlook the possibility that allosteric communication in different proteins is dominated by motions of different frequencies. This work finds that when the orthosteric and allosteric sites are close together, local fast modes dominate allosteric communication, while when they are far apart, global slow modes matter more. Building on this, CorrSite2.0 computes correlations separately for the 3 slowest modes and the 10 fastest modes and takes the larger Z-score as the final score. It identifies 35/36 known allosteric sites in the development data set (97.2%) and reaches 90% on an independent test set, and it successfully identifies both allosteric sites of the SARS-CoV-2 main protease at once.
Part 1: Research Question
Allosteric regulation is one of the central mechanisms by which protein function is controlled: a ligand binds at an allosteric site far from the active center and, through dynamic propagation inside the protein, changes the conformation and function of the active site. You can picture a protein as a precision mechanical device, where pressing a distant “button” changes how the core parts operate. Because allosteric drugs target non-conserved distal sites, they are usually more selective, may cause fewer side effects, and can bypass resistance mutations at the orthosteric site. Even so, the first step in allosteric drug design, accurately predicting allosteric sites on a protein, remains a challenge, because allosteric sites are not as easy to spot through sequence conservation as active centers are, and their regulatory mechanism depends heavily on the protein’s dynamic properties.
The authors previously developed CorrSite1.0, which predicts allosteric sites by using a Gaussian network model (GNM) to compute motion correlations between the orthosteric site and candidate pockets. The basic logic is that if a surface pocket is highly correlated in motion with the known orthosteric site, then that pocket may be an allosteric site. GNM approximates a protein as an elastic network, representing each residue as a node at its Cα atom and connecting nodes no more than 7 Å apart with identical springs. Spectral decomposition of the network matrix yields a series of motion modes from slow to fast. The problem with CorrSite1.0 is that it lumps all of the normal modes together in one calculation. These modes have different physical meanings: slow modes (low frequency) correspond to global opening and closing motions at the domain level, while fast modes (high frequency) reflect local residue vibrations. Summing over all modes can dilute the allosteric signal that actually matters.
The authors noticed that CorrSite1.0 predicts well for orthosteric-allosteric pairs that are far apart in space but performs poorly when the two sites are close to each other. That prompted their hypothesis: allosteric communication in different proteins may be dominated either by slow modes or by fast modes, so mixing all modes together dilutes the dynamic signal that is genuinely useful.
Part 2: Methodology: Two dynamic types of allosteric communication
The authors systematically tested how different combinations of motion modes (the 3/10/20 slowest modes, intermediate modes, the 10/20 fastest modes, and all modes) affect the ranking of allosteric sites across 35 proteins (including monomers, multimers, and kinases, with lengths from 169 to 917 residues), and found that these proteins fall clearly into two categories.
Fast-mode dominant (13 proteins): With the 10 fastest motion modes, the true allosteric site has the highest Z-score ranking (median around rank 2). With slow modes or all modes, the ranking drops noticeably. What these 13 proteins have in common is that the orthosteric and allosteric sites are close together in space: in 92.3% of them, the shortest distance between the two sites is within 4 Å. Aurora kinase A (ARK-1) is the archetypal example, with its orthosteric and allosteric sites spatially adjacent and their dynamic coupling expressed mainly in rapid local vibrations. Using all modes, as CorrSite1.0 does, lets a mass of functionally irrelevant slow and intermediate components drown out this key signal carried by the local fast modes.
Slow-mode dominant (22 proteins): The ranking is highest with the 3 slowest modes, better even than with the 10 or 20 slowest. Why do only 3 modes work better than 10? Because the slowest few modes correspond to the protein’s most essential global motions: opening and closing between domains, overall twisting, and large-scale concerted displacements. Adding more modes brings in local fluctuations unrelated to allosteric function and reduces the contrast between the true allosteric pocket and the other pockets. In these proteins the orthosteric and allosteric sites are usually far apart, with the two sites more than 4 Å apart in 65.2% of them. In pyruvate dehydrogenase kinase isoenzyme 2 (PDKII), for instance, the two sites are 17.8 Å apart and the allosteric signal is transmitted through concerted motion of the whole protein.
Part 3: Key Figure Analysis
Figure 1: The two protein classes are dominated by different modes
What this figure asks: How were the two dynamic types of allosteric communication, fast-mode and slow-mode, told apart?
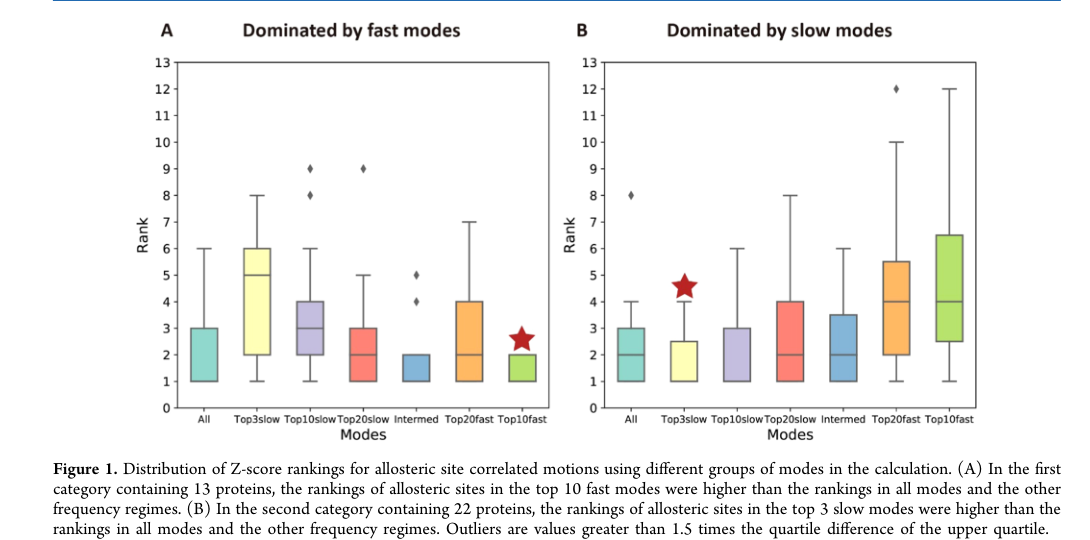
Figure 1. Distribution of the Z-score rankings of the true allosteric sites when different groups of modes are used. (A) The fast-mode dominant group. (B) The slow-mode dominant group.
A systematic comparison of mode combinations across 35 proteins shows that the proteins separate cleanly into two classes. Fast-mode dominant (13 proteins): the true allosteric site ranks highest with the 10 fastest modes (median around rank 2) and ranks worse with slow modes, and in most of these proteins the orthosteric and allosteric sites are very close together (92.3% within 4 Å).
Slow-mode dominant (22 proteins): the ranking is highest with the 3 slowest modes, better even than with 10 or 20, because the slowest few modes correspond to core motions such as domain opening and closing and global twisting, and adding more modes only brings in irrelevant fluctuations. In these proteins the two sites are usually far apart (more than 4 Å in 65.2% of cases). By lumping all modes together, CorrSite1.0 dilutes precisely these two signals.
Figure 2: The structural factors that decide which mode type dominates
What this figure asks: How does the spatial distance between the orthosteric and allosteric sites determine which type of motion mode dominates signal transmission?
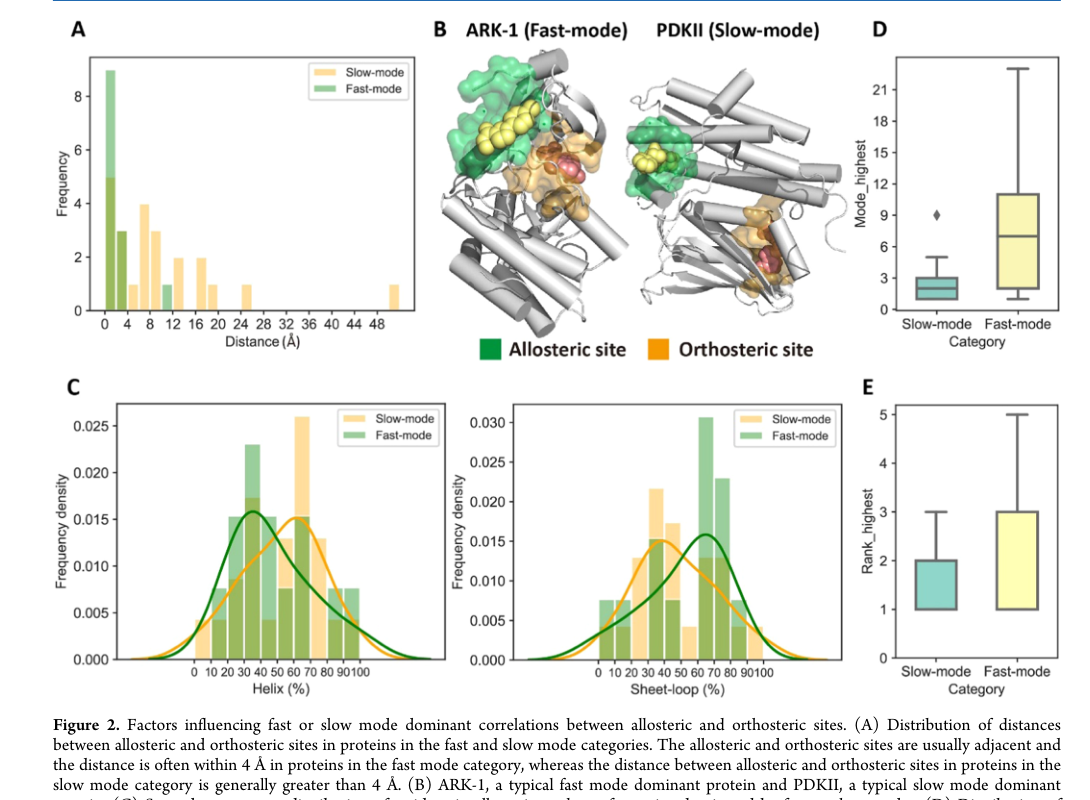
Figure 2. Factors that determine whether fast or slow modes dominate. (A) Distribution of the distances between the two sites. (B) Structural comparison of ARK-1 (fast) and PDKII (slow). (C) Secondary structure composition. (D-E) Validation from single-mode correlations.
- Panel A/B: Distance is the key factor. In the fast-mode group the two sites are essentially adjacent (ARK-1), while in the slow-mode group they are clearly distant (17.8 Å apart in PDKII). Within a single domain, communication runs through local fast vibrations; across domains, it requires global concerted motion (61.5% of the fast-mode group have both sites in the same domain, while 60.9% of the slow-mode group have them in different domains).
- Panel C-E: Residues in slow-mode pockets are more often found in alpha helices (helices are long and rigid, so they readily take part in global opening and closing); 87% of the highest correlations in the slow-mode group fall within the 3 slowest modes, while 69.2% of those in the fast-mode group fall in the higher-frequency region, corroborating the classification from a single-mode perspective.
Figure 3: The CorrSite2.0 workflow
What this figure asks: Without deciding in advance which class a protein belongs to, how can both fast and slow modes be covered at once?
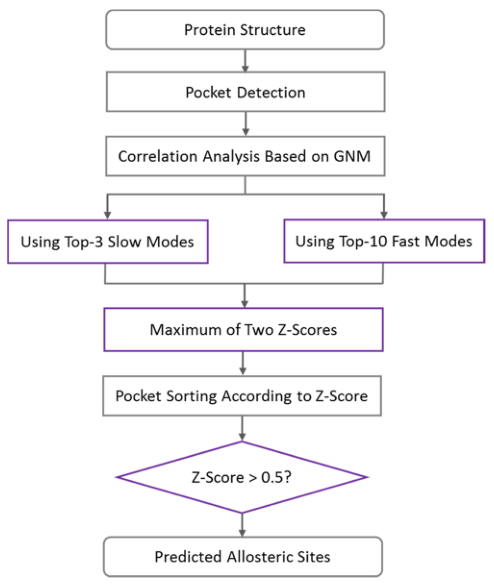
Figure 3. The CorrSite2.0 workflow: input structure → pocket detection → GNM-based correlation analysis → the 3 slowest and the 10 fastest modes computed separately → take the larger of the two Z-scores → Z > 0.5 marks an allosteric site.
The heart of the workflow is that last step, taking the larger of the two Z-scores (Z_final = max(Z_slow3, Z_fast10)). Classifying the protein first and then choosing the modes would require knowing where the allosteric site is, which contradicts the prediction task itself, so the method simply computes both and keeps the larger one, capturing the signal whether the protein is fast-mode or slow-mode dominant. Pockets are detected with CAVITY, normal mode analysis is done on a GNM elastic network, and Z > 0.5 marks a potential allosteric site.
Figure 4: Comparison with other methods
What this figure asks: How much does adding a separate fast-mode channel improve identification accuracy?
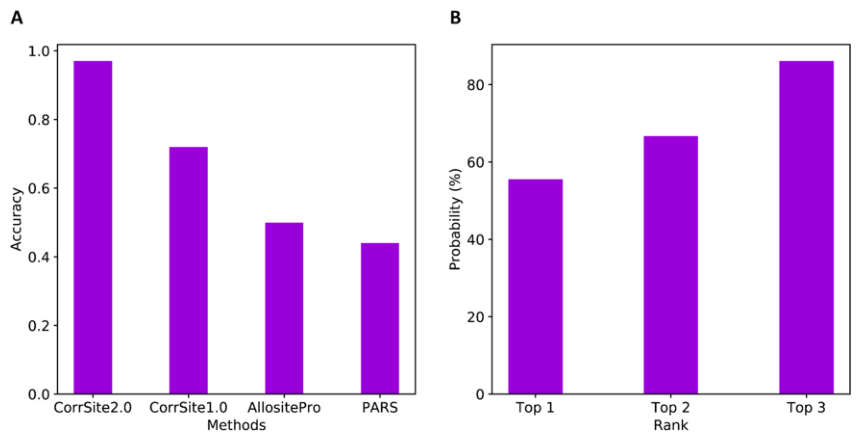
Figure 4. CorrSite2.0 compared with other allosteric site prediction methods. (A) Identification accuracy of each method. (B) Probability that the true allosteric pocket is ranked in the top 1/2/3.
- Panel A: On the development set, CorrSite2.0 identifies 35/36 (97.2%), far ahead of CorrSite1.0 (72.2%), AllositePro (50%), and PARS (44.4%). The improvement comes mainly from the fast-mode channel: 6 of the 10 sites missed by CorrSite1.0 are in fast-mode dominant proteins. Panel B: The true pocket is ranked top 1 with a probability of 55.6%, top 2 with 66.7%, and top 3 with 86.1%. On the independent test set CorrSite2.0 also reaches 90% (18/20).
Figure 5: The two allosteric sites of the SARS-CoV-2 main protease
What this figure asks: On the SARS-CoV-2 main protease, can CorrSite2.0 find both of the known allosteric sites?
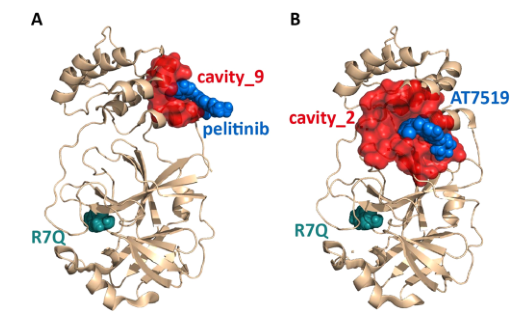
Figure 5. CorrSite2.0 predictions for SARS-CoV-2 3CLpro. Allosteric site ligands are shown as blue spheres and the orthosteric site ligand as cyan spheres. (A) cavity_9 + pelitinib. (B) cavity_2 + AT7519.
Two allosteric sites are known on the main protease. CorrSite2.0 identifies both, whereas CorrSite1.0, AllositePro, and PARS each find only one. The cavity_2 site in Panel B sits in a deep groove at the domain interface (where AT7519 binds), with a Z-score of 2.24 and rank 1; the cavity_9 site in Panel A is a small hydrophobic pocket (where pelitinib binds), with a Z-score of 0.66 and rank 6, not high but above the threshold, and it is exactly this small pocket that the other three methods miss. Recomputing on the ligand-free apo structure still identifies both sites correctly, showing that what is being captured is the dynamic coupling intrinsic to the structure.
Part 4: Key Contributions
On development data set I (35 proteins, 36 known allosteric sites, protein lengths from 169 to 917 residues), CorrSite2.0 correctly identified 35 of them (97.2%), substantially better than CorrSite1.0 (72.2%), AllositePro (50.0%), and PARS (44.4%). The improvement comes mainly from the fast-mode channel: 6 of the 10 proteins that CorrSite1.0 failed on are fast-mode dominant. Because low-frequency modes in a GNM usually contribute more to the overall fluctuations, the slow-mode signal survives when all modes are used, but the local functional signal carried by fast modes is easily drowned out by the mass of other modes. Adding a separate fast-mode channel lets CorrSite2.0 compensate for this systematic bias.
The true allosteric pocket is ranked top 1 with a probability of 55.6%, top 2 with 66.7%, and top 3 with 86.1%. This matters a great deal for downstream docking, virtual screening, and experimental validation, because researchers rarely have the resources to test every surface pocket one by one, and the top three is a manageable set of candidates. On independent test set II (19 proteins, 20 known allosteric sites), CorrSite2.0 predicted 18 correctly (90%), versus 60% for CorrSite1.0, 45% for AllositePro, and only 30% for PARS, indicating that the improvement generalizes well.
It should be noted that the “97.2%” and “90%” here refer to the detection success rate for known allosteric sites (that is, a Z-score above the 0.5 threshold), which is not quite the same as accuracy in a standard binary classification problem. A protein may yield several pockets with Z > 0.5, and the paper does not quantify in detail the number of false positive pockets or the precision-recall curve.
Application case: the SARS-CoV-2 main protease
The SARS-CoV-2 main protease (3CLpro/Mpro) is essential for viral replication and a key target for anti-coronavirus drug development. Through fragment screening and structural biology, researchers have already found two allosteric sites on this protein. CorrSite2.0 successfully identified both at once, while CorrSite1.0, AllositePro, and PARS could each identify only one of them.
The second allosteric site (cavity_2) lies in the deep groove between the catalytic domains and the dimerization domain, where the compound AT7519 can bind (PDB: 7AGA). CorrSite2.0 gives it a Z-score of 2.24 and rank 1, a very strong signal. Sitting at a domain interface, this site may simultaneously affect the conformation of the catalytic domain, protein dimerization, and the spatial arrangement of the active site, which makes its global motion correlation with the orthosteric site especially prominent.
The first allosteric site (cavity_9) is a hydrophobic pocket (comprising Ile213, Leu253, Gln256, Val297, and Cys300) where the kinase inhibitor pelitinib can bind (PDB: 7AXM). CorrSite2.0 gives it a Z-score of 0.66 and rank 6; the ranking is not high, but it clears the 0.5 threshold and is still identified correctly. This smaller allosteric site is missed by all three of the other methods, which illustrates the advantage of the two-channel strategy in covering different types of allosteric pocket. The authors also recomputed using an apo structure without the allosteric ligand (PDB: 2Q6G), and both sites were still identified correctly, showing that the method detects dynamic coupling features intrinsic to the protein structure and is robust to small conformational changes.
Part 5: Limitations and Outlook
It depends on a known orthosteric site: CorrSite2.0 requires the user to specify the orthosteric pocket or to supply the orthosteric site residues, so it is more accurately described as predicting allosteric sites dynamically coupled to a known orthosteric site, rather than as a whole-protein search method that starts from nothing.
Pocket detection quality limits the results: both failures in the independent test trace back to CAVITY detection. For GDH1 the allosteric pocket was not fully covered (after redefining the pocket as the residues within 8 Å of the allosteric ligand, the Z-score became 0.67 and the prediction was correct), and for MIF the allosteric pocket overlaps heavily with the orthosteric pocket residues, leaving a pocket too small to work with once the overlapping residues were removed, so the prediction failed. Real applications may also run into cryptic or transient pockets that CAVITY struggles to detect.
GNM is a simplified model: it connects all neighboring residues with identical springs, ignoring different types of non-covalent interactions, atomic-level chemical detail, solvent effects, and large anharmonic conformational transitions, so what it identifies is dynamic coupling within equilibrium fluctuations rather than the complete free energy mechanism of allostery. Moreover, correlated motion does not mean causation: a high correlation shows that two regions move together, but it does not directly prove that perturbing the candidate pocket will change orthosteric site function, nor does it guarantee that the pocket can bind a developable small molecule. Predictions still need further validation through mutagenesis, enzyme activity assays, molecular dynamics simulations, or structural biology.
About the Corresponding Author
Luhua Lai is a professor in the College of Chemistry and Molecular Engineering at Peking University and a member of both the Center for Quantitative Biology at Peking University and the Peking-Tsinghua Center for Life Sciences. She received her BS and PhD from Peking University and has long worked on protein structure and function, computational drug design, mechanisms of allosteric regulation, and protein design. Her group has developed several widely used computational tools, including the protein pocket detection program CAVITY, the CorrSite family of allosteric site prediction methods, and CavityPlus, the online platform that integrates them, systematically advancing allosteric drug discovery based on the dynamic properties of proteins. The paper’s first author, Juan Xie, is also a member of Luhua Lai’s group at Peking University, working mainly on allosteric regulation in proteins and coevolution analysis.
Citation
Xie, J., Wang, S., Xu, Y., Deng, M., & Lai, L. (2022). Uncovering the Dominant Motion Modes of Allosteric Regulation Improves Allosteric Site Prediction. Journal of Chemical Information and Modeling, 62(1), 187-195. https://doi.org/10.1021/acs.jcim.1c01267