
AF2BIND: predicting small-molecule binding sites using the pair representation of AlphaFold2
Link: full article
Authors: Artem Gazizov, Anna Lian, Casper Goverde, Jody Mou, Sergey Ovchinnikov, Nicholas F. Polizzi
Nature Methods, March 2026
On this page
Finding where a small molecule might bind on a protein is the starting point of drug discovery. Traditional methods rely either on known homologous structures or on geometric pocket detection, and they are often helpless for proteins that have no known ligand and no obvious cavity.
A team from Harvard and MIT has proposed AF2BIND: it feeds AlphaFold2 the target protein together with 20 amino acid “baits”, reads out AlphaFold2’s internal pair representation, and then uses a simple logistic regression model to predict the probability that each residue participates in small-molecule binding. No MSA, no known ligand and no homologous template are required.
This post first explains the core idea behind AF2BIND, then uses three figures to walk through the method, cross-family generalization and the discovery of new sites at proteome scale.
Part 1: Research Question
There are three common routes to predicting small-molecule binding sites on proteins. Homology transfer (e.g., AlphaFill) carries known ligands over from similar proteins, but fails on new folds or on sites never occupied by a ligand. Geometric pocket detection (e.g., fpocket, P2Rank) identifies pockets from surface cavities and easily misses shallow or diffuse binding regions. Deep learning trained from scratch requires large amounts of non-redundant protein–ligand complex data and tends to overfit when data are limited.
The authors noticed an interesting fact: AlphaFold2 is trained only to predict protein structure and never sees small-molecule binding. Yet to predict folds accurately, its internal representations must encode a great deal of information relevant to binding sites: local geometry, residue–residue interactions, solvent exposure, charge and polarity environment, sequence conservation and coevolution. Small-molecule binding sites often have chemical environments that are not fully satisfied by intraprotein interactions (for example, buried polar groups or locally frustrated structure), and these features are very likely already reflected in AlphaFold2’s internal features.
The question is: how can this information be “read out”? The authors target the stricter problem of de novo binding-site prediction: for a protein with no known ligand and no transferable homologous binding site, predict where small molecules might bind from sequence and structure alone.
Part 2: Methodology: Using 20 amino acids as probes to read out AF2’s pair representation
Bait amino acids: surrogate probes for small-molecule functional groups
AF2BIND takes three inputs: the amino acid sequence of the target protein, its backbone structure (used as an AlphaFold2 template), and the 20 natural amino acids as “bait amino acids”, one of each, each as a separate short chain. This is the most creative part of the method. The baits act as surrogate probes for small-molecule functional groups: Phe/Trp/Tyr approximate aromatic groups, Asp/Glu approximate carboxylates, Lys/Arg approximate positively charged groups, Ile/Leu/Val approximate hydrophobic groups, and Asn/Gln/Ser/Thr approximate polar groups. Analyzing about 40,000 compounds in the PDB, the authors found that, as measured by Morgan fingerprints, about 46%–50% of a molecule’s chemical environment can on average be covered by amino acid functional groups.
Pair representation + logistic regression
AlphaFold2 runs a single forward pass (no recycling), and the pair representation between target residues and the 20 baits is extracted. AlphaFold2 normally performs several rounds of recycling to refine the structure, but AF2BIND needs only one, because the authors want to capture the initial attention signal between the target protein and the baits before the baits are placed by the structure module. Side-chain dihedral information is also masked at input, keeping only backbone and near-Cβ information, so the model does not depend on precise side-chain rotamers.
For each residue, the pair representation yields a 20 × 2 × 128 = 5,120-dimensional feature vector, which is fed into a logistic regression model to produce P(bind). The authors deliberately chose a linear model over a complex neural network to preserve interpretability: the contribution of each bait to the prediction can be decomposed directly, amounting to a rough “chemical fingerprint of the site”. It answers not only “where might binding occur” but also gives a first indication of “whether the site leans hydrophobic or polar”. The recommended classification threshold is P(bind) > 0.28, corresponding to about 67% recall and 63% precision.
Rigorous data splitting
The training data come from 1,897 single-chain protein–small-molecule complexes in the PDB. The 67 complexes in the test set are not only dissimilar in sequence to the training set, they also share no domain classifications (ECOD, CATH, SCOP2B), no Pfam annotations and no pocket-structure similarity. This matters: even when two proteins differ in overall sequence, their binding pockets can still be highly similar, and with a sequence-only split the model might simply be “memorizing pockets”. Under this split, AF2BIND achieves a binding-residue recovery of 66.2% and a ROC AUC of 0.936 in tenfold cross-validation (see Figure 3 for details).
Part 3: Key Figure Analysis
Figure 1: The AF2BIND workflow
What this figure asks: How does AF2BIND use AlphaFold2’s internal pair representation to predict small-molecule binding sites?
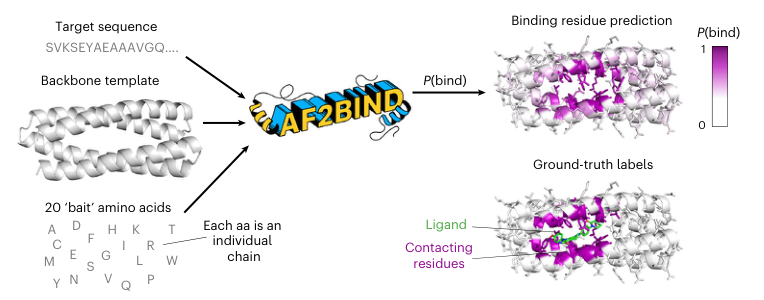
Figure 1. The AF2BIND workflow.
The figure shows the whole pipeline from left to right. The input on the left has three parts: the target protein sequence (the letter string at the top), the 3D backbone structure of the protein, and the 20 standard amino acid “baits” (the list at the bottom, each as a separate short chain). All three are fed into AlphaFold2 for a single forward pass, without recycling.
The matrix in the middle is the pair representation produced by AlphaFold2. AF2BIND uses only the blue and green regions, i.e., the pair features between target residues and the 20 baits: blue corresponds to the target→bait direction and green to the bait→target direction. Each residue gets 20 × 2 × 128 = 5,120 features, which are flattened and fed into the logistic regression.
The output on the right: the protein surface is colored from white to purple, with deeper purple indicating higher P(bind). The green sticks are the true ligand. Residues near the binding site appear deep purple and coincide closely with the true ligand position, showing that features extracted from the pair representation can effectively locate binding sites.
The core idea conveyed by this figure is that, given a protein sequence, its backbone and 20 amino acid probes, the model outputs residue-level small-molecule binding probabilities without needing to know in advance what the actual ligand is. The model does no docking; instead it answers the question “based only on the protein’s own structure and AF2’s internal representations, which residues have the features of small-molecule binding?”
Figure 2: From pair representation to binding probability
What this figure asks: How exactly does AF2BIND turn AF2’s pair representation into a residue’s binding probability? How much does each bait contribute?
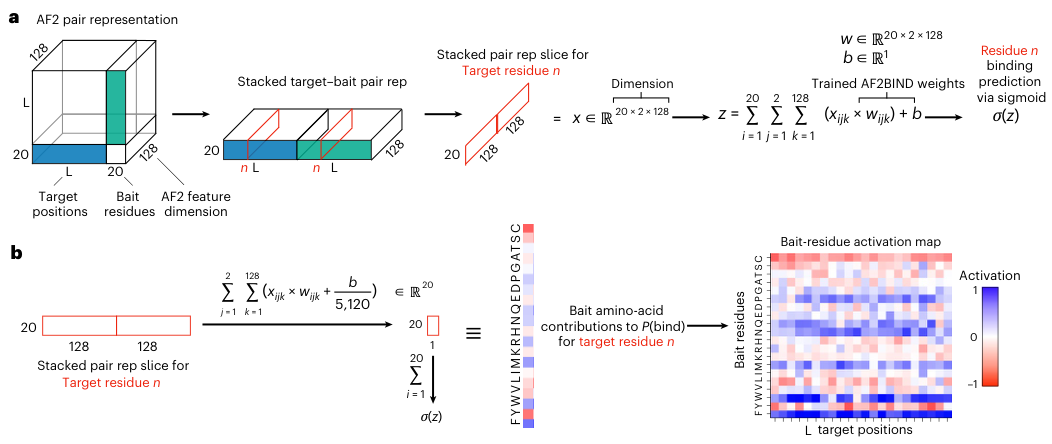
Figure 2. (a) The pair features between a target residue and the 20 baits in both directions (blue, green) are flattened into a 20 × 2 × 128-dimensional vector and passed through logistic regression and a sigmoid to obtain P(bind). (b) The linear model can be split by bait, giving the activation of each bait amino acid for each target residue.
- Panel a: The cube on the left is AF2’s pair representation, with side length L+20 (L target residues plus 20 baits) and a depth of 128 feature dimensions. The blue block is the target→bait direction and the green block is the bait→target direction. AF2’s pair representation is asymmetric, so both directions are used. Slicing out the n-th target residue gives a 20 × 2 × 128 = 5,120-dimensional input; multiplying by the trained weights w, adding the bias b and applying a sigmoid gives P(bind). The entire classifier is just this one layer.
- Panel b: Because the model is linear, the total score z can be split exactly into 20 parts: for each bait, its 256 features are multiplied by their weights and summed, and a share of the bias is allotted. The resulting 20 numbers are the “activations” of each bait. In the heatmap on the right, the horizontal axis is target residue position and the vertical axis is the 20 baits, with blue for positive and red for negative contributions.
This figure explains why the authors insisted on logistic regression: a multilayer network might squeeze out a slightly higher score, but it would no longer be possible to tell “which bait is driving the prediction”. This decomposition is exactly the basis for the chemical fingerprint analysis in Figure 5.
Figure 3: Which pretrained representation understands binding sites best
What this figure asks: How much stronger is AF2’s pair representation than the representations of sequence models and inverse folding models? Does the advantage hold protein by protein?
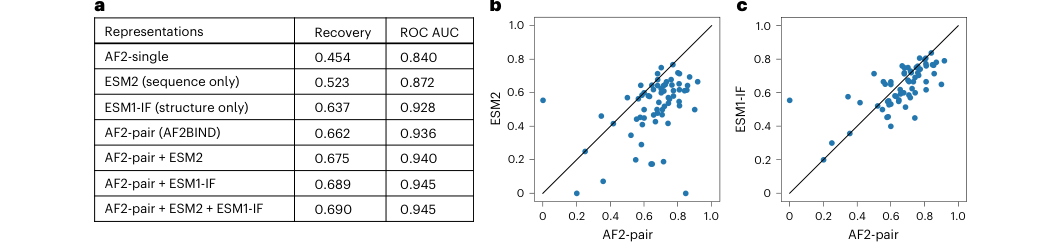
Figure 3. (a) Mean binding-site recovery and ROC AUC of logistic regression on different representations in tenfold cross-validation. (b, c) Per-protein comparison of recovery on the test set for AF2-pair versus ESM2 and ESM1-IF; each point is one target protein.
Metric: recovery borrows the evaluation approach of contact prediction. If a protein has n true binding residues, the predictions are ranked by confidence and the top n are taken to see how many are hits. This allows fair comparison even when the scores of different models are not calibrated to the same scale.
- Panel a: The AF2 single-residue representation scores only 0.454; sequence-only ESM2 reaches 0.523, showing that binding sites leave an evolutionary sequence signal; backbone-only ESM1-IF reaches 0.637, showing that backbone geometry by itself encodes a lot of binding information; AF2-pair, at 0.662 / ROC AUC 0.936, is the strongest single representation. Concatenating all three only reaches 0.690 / 0.945, a limited gain, so the authors chose to build the model on the simpler and more interpretable AF2-pair alone.
- Panels b, c: The horizontal axis is AF2-pair and the vertical axes are ESM2 and ESM1-IF, respectively; points below and to the right of the diagonal mean AF2-pair does better. Against ESM2, most points fall below the diagonal; against ESM1-IF, the points hug the diagonal more closely and the gap narrows considerably, as backbone information already covers a large part of the signal.
Figure 4: Cross-family generalization
What this figure asks: Can the model predict binding sites on protein families it never saw during training?
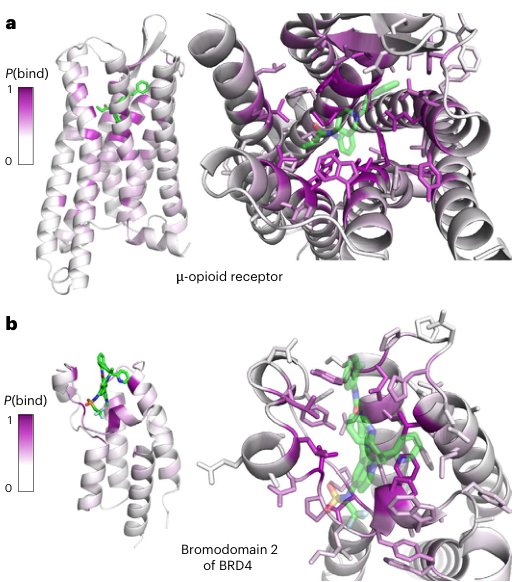
Figure 4. Cross-family generalization tests.
- Panel a: the μ-opioid receptor and fentanyl. This is a GPCR; during training the authors excluded the entire GPCR family along with similar structures and pockets. The protein surface is colored by P(bind) (white→purple), and the green sticks are fentanyl. High-scoring residues cluster in the orthosteric pocket inside the transmembrane region, coinciding closely with where fentanyl sits, while regions far from the ligand stay white. Notably, these high-scoring residues are not simply correlated with sequence conservation; the orthosteric site is not always the most conserved region of the protein, which suggests that the model has learned more general chemical features of binding sites.
- Panel b: the second bromodomain of BRD4. Bromodomains and similar proteins were likewise excluded from training. The purple high-scoring residues cluster around the acetyl-lysine recognition pocket where the inhibitor binds, and the model assigns clearly differentiated probabilities to different residues within the pocket.
Together, the two cases demonstrate that AF2BIND has genuine cross-family generalization. Traditional geometric pocket methods output “there is a cavity here”, whereas AF2BIND pinpoints “which residues in the cavity are most likely to take part in small-molecule interactions”. This residue-level ranking can be used to choose docking restraints, guide mutagenesis experiments and identify the core anchor residues of a pocket. Moreover, across several crystal structures of the μ-opioid receptor (mean Cα RMSD about 0.7 Å), the standard deviation of each residue’s P(bind) is only about 0.02, showing that the predictions are robust to small changes in the input structure.
Figure 5: Bait activations form a chemical fingerprint of the site
What this figure asks: Can the activation pattern of the bait amino acids tell us whether a site prefers hydrophobic or polar ligands?
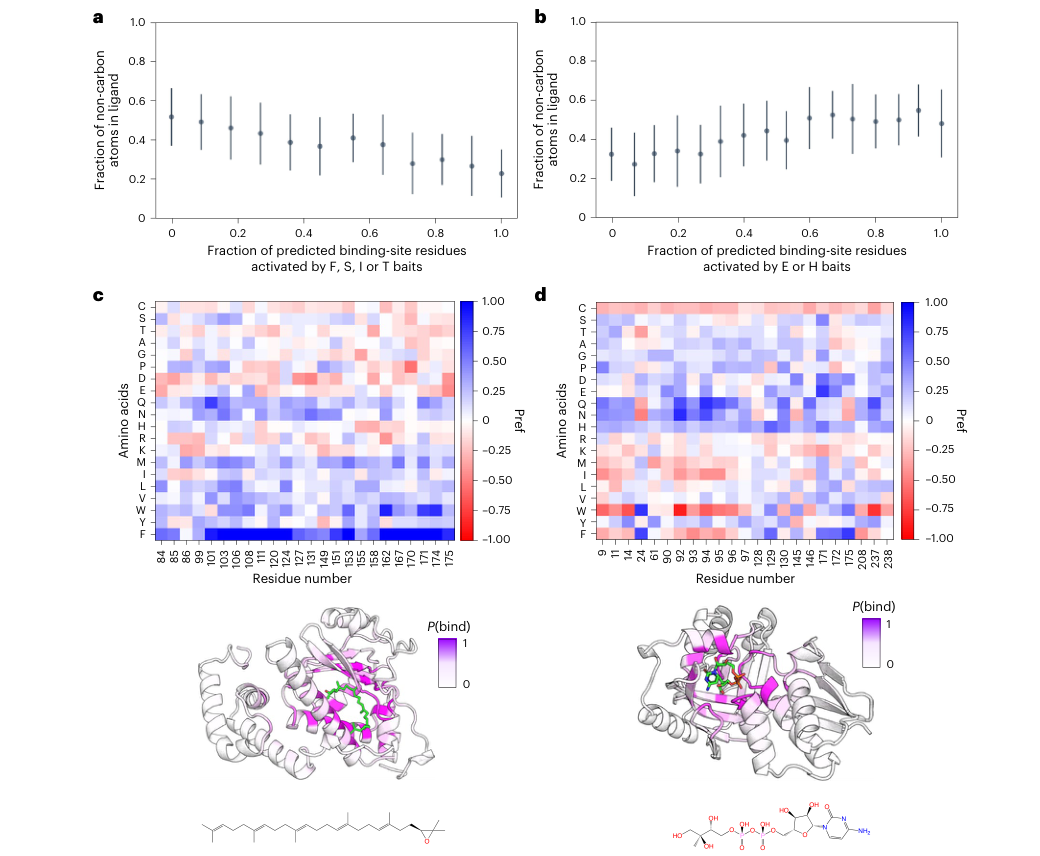
Figure 5. (a) The higher the fraction of predicted binding residues activated by the F, S, I and T baits, the lower the fraction of non-carbon atoms in the ligand. (b) The higher the fraction activated by the H and E baits, the more hydrophilic the ligand. (c) Hydrophobic ligand case PDB 4OMJ (2,3-oxidosqualene), dominated by W and F activations. (d) Polar ligand case PDB 2V2Z: W and F activations drop while polar baits such as Q and N rise. a and b show mean ± standard deviation over 1,896 proteins.
- Panels a, b: The authors performed the activation analysis on all 1,896 protein–ligand complexes, using “the fraction of non-carbon atoms in the ligand” as a measure of hydrophilicity. Among all bait combinations, the F, S, I, T group has the highest Pearson correlation with ligand hydrophobicity: the more binding residues they activate, the more carbon-rich the ligand. The H, E pair has the highest correlation with hydrophilicity: the more they activate, the more heteroatoms the ligand contains. FSIT is the best combination selected from the data, and S and T are not themselves hydrophobic, so it should be viewed as a statistical pattern rather than interpreted bait by bait through chemical intuition.
- Panel c: In the upper heatmap, the vertical axis is the 20 baits and the horizontal axis is the predicted binding residues, with blue for positive activation. Supernatant protein factor (PDB 4OMJ) binds the highly hydrophobic terpenoid 2,3-oxidosqualene; in the heatmap, the F row is almost entirely deep blue, and W is also positive in many places. In the structure below, the purple high-P(bind) residues wrap neatly around the green ligand.
- Panel d: The substrate of kinase 2V2Z carries several hydroxyl and phosphate groups and is strongly polar. This time the W row turns red, and polar baits such as Q and N switch to positive contributions.
This figure takes AF2BIND one step beyond “where binding can occur” toward a rough judgment of “what kind of ligand suits the site”. For now it can only distinguish coarse-grained properties such as hydrophobic versus polar and is still far from predicting specific ligands, but it can already be used to choose fragment libraries or to set chemical preferences for docking.
Figure 6: Human proteome analysis
What this figure asks: At the scale of the human proteome, how many binding sites missed by traditional methods can AF2BIND discover?
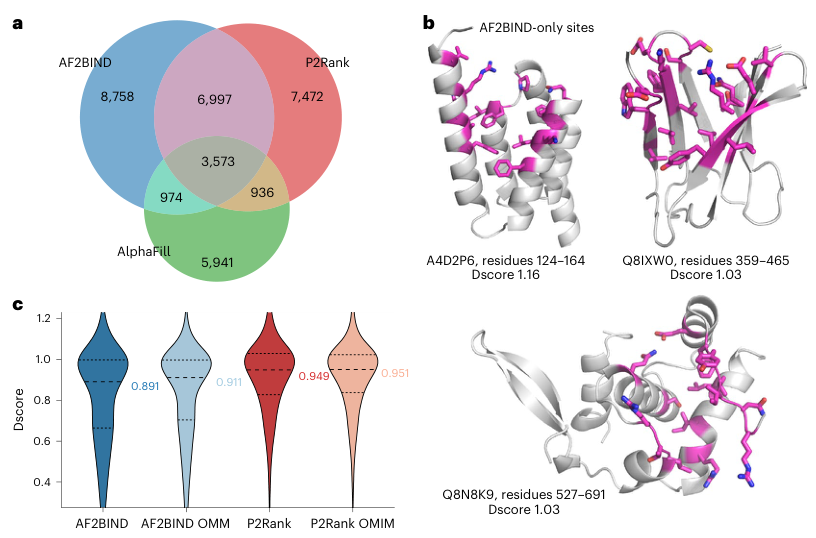
Figure 6. Site discovery across the human proteome.
- Panel a: Venn diagram of three methods. AF2BIND predicted a total of 20,302 binding sites (13,686 proteins), of which 6,997 are unique to AF2BIND——not predicted by either P2Rank or AlphaFill. Conversely, P2Rank also has 7,472 unique sites. The three methods capture partially different signals: AlphaFill relies on known homologous relationships, P2Rank relies on surface geometric pockets, AF2BIND relies on residue pair features from pretrained models.
- Panel b: examples of sites unique to AF2BIND. High-quality sites unique to AF2BIND (covered by neither P2Rank nor AlphaFill) are shown on three proteins. These sites may not be deep pockets in the traditional sense, but AF2BIND recognized binding features in the pair representation.
- Panel c: druggability comparison. Assessed by SiteMap Dscore, AF2BIND sites have a median of 0.891 (above the commonly used threshold of 0.83), but their distribution is shifted slightly left of P2Rank’s: sites found by AF2BIND are on average shallower, more exposed and somewhat less enclosed, whereas P2Rank favors deep, highly enclosed pockets. This neatly explains why the two methods are complementary: geometric methods excel at finding deep pockets, while AF2BIND excels at finding sites whose chemical environment suits binding but which are geometrically unremarkable. Among the roughly 5,700 disease-related proteins in the OMIM database, AF2BIND predicts sites in 3,556 proteins, and in 411 of them the sites are covered by neither P2Rank nor AlphaFill.
Part 4: Key Contributions
AF2BIND’s core contribution is demonstrating that AlphaFold2’s internal representations can be transferred to small-molecule binding-site prediction. This “pretrained model + lightweight downstream classifier” paradigm is directly in line with the NLP practice of extracting features from a large model and classifying with a linear probe. AF2BIND itself trains only the weights of the logistic regression layer, but it relies on the representational power AlphaFold2 learned from vast amounts of protein structure data.
The deeper finding is that the residue–residue interaction patterns inside proteins can be transferred to recognizing protein–small molecule interactions, because many small-molecule functional groups resemble the chemical environments of amino acid side chains locally. The bait amino acid design exploits this, allowing the model to make a first inference about a site’s chemical preferences. Decomposing the contributions of the 20 baits to P(bind), the authors found that proteins binding hydrophobic ligands are activated mainly by aromatic/hydrophobic baits such as Phe and Trp, whereas for a kinase binding a polar substrate, polar baits such as Gln and Asn contribute more prominently.
In practice, AF2BIND is best used together with geometric pocket methods such as P2Rank and fpocket: prioritize sites supported by both methods; for shallow sites unique to AF2BIND, check carefully whether they lie at functional interfaces or allosteric regions; use the bait activation analysis to judge chemical preferences; then screen ligands with docking or co-folding models (such as AlphaFold3, Boltz and RoseTTAFold All-Atom); and finally validate by fragment screening, SPR or chemical proteomics.
Part 5: Limitations and Outlook
If the pocket in the input structure has completely collapsed (a cryptic pocket), the model usually misses it. In the β-lactamase case, a helix closes off the pocket in the apo state, and AF2BIND cannot predict the buried binding residues. This is the model’s main structural limitation.
The 20 natural amino acids cover only a limited region of chemical space, and functional groups such as halogens, boronic acids, sulfonamides and unusual heterocycles cannot be represented; the authors suggest using richer sets of small-molecule fragments as baits in the future. The training data are biased toward the classic drug-like pockets already crystallized in the PDB, with far more orthosteric than allosteric sites. The human proteome analysis relies mainly on single-chain AlphaFold structures, whereas many real binding sites occur at oligomer interfaces, in protein–nucleic acid complexes, or in pockets formed by multidomain rearrangements. A high P(bind) only indicates that a residue has small-molecule binding features; it does not directly give the ligand pose, affinity or selectivity.
About the Corresponding Authors
Sergey Ovchinnikov is a faculty member in the Department of Biology at MIT, the affiliation listed on this paper; he was previously a John Harvard Distinguished Science Fellow at Harvard. He received his undergraduate degree in biophysics from the University of California, Davis, and his PhD in biophysics from the University of Washington (advisor: David Baker), where he studied protein coevolution and structure prediction; he then did postdoctoral research at Harvard University, and his research focuses on protein design and machine-learning-driven protein structure prediction. Nicholas F. Polizzi is listed on this paper with the Department of Cancer Biology at the Dana-Farber Cancer Institute and the Department of Biological Chemistry and Molecular Pharmacology at Harvard Medical School. He received his undergraduate degree in chemistry from Rutgers University and his PhD in chemistry from the University of Pennsylvania, followed by postdoctoral research at Caltech and MIT, and his research focuses on computational protein design and protein–small molecule interactions.
Citation
Gazizov, A., Lian, A., Goverde, C., Mou, J., Ovchinnikov, S., & Polizzi, N. F. (2026). AF2BIND: predicting small-molecule binding sites using the pair representation of AlphaFold2. Nature Methods, 23(3), 626-635. https://doi.org/10.1038/s41592-026-03011-2