
Accurate RNA 3D structure prediction using a language model-based deep learning approach
Link: full article
Authors: Tao Shen, Zhihang Hu, Siqi Sun, …, Yu Li
Nature Methods, December 2024
On this page
An RNA’s function is determined by its three-dimensional structure, yet among the roughly 214,000 structures in the PDB, RNA-only structures make up less than 1%. Protein structure prediction has AlphaFold2, but RNA has long lacked a tool that is accurate, fast, fully automated and free of expert intervention. The scarcity of training data is the first hurdle standing in the way of deep learning.
A team from The Chinese University of Hong Kong, Fudan University, Zelixir Biotech, the Wyss Institute at Harvard, MIT, Arizona State University and other institutions has introduced RhoFold+. It first uses RNA-FM, a language model pretrained on about 23.7 million unlabeled RNA sequences, to learn the ‘grammar’ of RNA sequences; it then fuses in evolutionary information from a multiple sequence alignment (MSA); finally, a geometric structure module designed specifically for RNA outputs the all-atom structure directly.
The scorecard: on 24 single-chain RNA-Puzzles targets, the average r.m.s.d. is 4.02 Å, 2.30 Å lower than the runner-up FARFAR2; on the 6 natural RNA targets of CASP15, the average is 7.72 Å, on par with the winning expert-guided group AIchemy_RNA2 (7.77 Å); and on 76 single-chain RNA structures solved after the training cutoff, the average r.m.s.d. is about 2.2 Å lower than AlphaFold3. Excluding the MSA search, inference for a single structure takes only about 0.14 seconds.
This post first explains how the model is built and how the training data gap is filled, then walks through the paper’s five main figures one by one, and finally discusses its limits: the best results still depend on high-quality MSAs, and the spatial assembly of multiple helices at junctions remains the dominant failure mode.
Part 1: Research Question
RNA sits at the crossroads of the central dogma. More than 85% of the human genome is transcribed, yet only about 3% encodes proteins, and the functions and structures of a large share of the transcribed RNA remain unknown. RNA function depends heavily on 3D conformation: ribozymes rely on specific folds to carry out catalysis, and riboswitches recognize metabolites through their binding pockets. Developing small-molecule drugs that target RNA and designing synthetic biology parts likewise require knowing what the molecule looks like in space.
The first difficulty is data. As of December 2023, among the roughly 214,000 structures in the PDB, RNA-only structures accounted for less than 1.0%, and RNA-containing complexes for only 2.1%. RNA is conformationally flexible: the same chain may adopt different conformations depending on ions, ligands or protein partners, which makes structure determination by X-ray crystallography, NMR or cryo-EM slow and laborious.
Computational methods fall roughly into three camps:
Template-based modeling (such as ModeRNA) is constrained by the very small library of RNA templates; sampling-based de novo prediction (such as FARFAR2 and SimRNA) samples conformations at scale under the guidance of an energy function, which is more powerful but extremely computationally expensive; deep learning (such as DeepFoldRNA, trRosettaRNA and AlphaFold3) depends on MSAs, which are costly to search for and offer no help for orphan RNAs that lack homologous sequences.
This creates a set of competing tensions: deep learning needs large amounts of structural data, and RNA is precisely where structural data are scarcest; sampling methods do not depend on training data, but they are too slow; MSAs provide evolutionary information, but they are expensive to search for and of no help for orphan RNAs without homologs or for designed RNAs.
The question this paper sets out to answer
Can massive amounts of RNA sequence without structural annotation compensate for the shortage of structural data, yielding an RNA 3D structure prediction system that is accurate, fast, fully automated and free of expert intervention?
RhoFold+ is an upgrade of the same team’s earlier model RhoFold (released as a preprint under the name E2Efold-3D). RhoFold competed in the ‘expert’ (human) category of CASP15 under the team name AIchemy_RNA; RhoFold+ turns the entire pipeline into a fully automated, differentiable end-to-end system, positioning it closer to the ‘server’ category, where no manual intervention is allowed. The authors restrict the scope of the study to single-chain RNA, that is, RNA chains with limited interactions with other molecules, aiming to solve this class of problem thoroughly first and use it as a starting point for tackling more complex structural problems.
Part 2: Methodology: How RhoFold+ is built
Overall pipeline
Input: a single RNA sequence
→ Pathway 1: the RNA-FM language model extracts a single-sequence representation
→ Pathway 2: Infernal + rMSA search for homologous sequences to build MSA features
→ Rhoformer (12 layers) fuses the two streams of information, updating the MSA representation and the nucleotide pair representation
→ Structure module (8 layers, built around IPA) predicts the local coordinate frame and torsion angles of each nucleotide
→ All-atom coordinates are reconstructed, and constraints such as base pairing are imposed in 3D space
→ After about 10 rounds of recycling, the model outputs the all-atom structure, the secondary structure and per-atom confidence (pLDDT)
Part 3: Key Figure Analysis
The five main figures follow a single line of argument: Figure 1 presents the method and the evaluation framework; Figure 2 looks at the community challenges RNA-Puzzles and CASP15; Figure 3 tests whether the model generalizes to unseen structures, types and families; Figure 4 shows capabilities beyond 3D structure; and Figure 5 uses ablations and MSA sampling to answer the question ‘where does the performance actually come from?’
Figure 1: Model architecture and evaluation framework
What this figure asks: How does RhoFold+ fuse an RNA language model with MSA information to predict all-atom 3D structures?
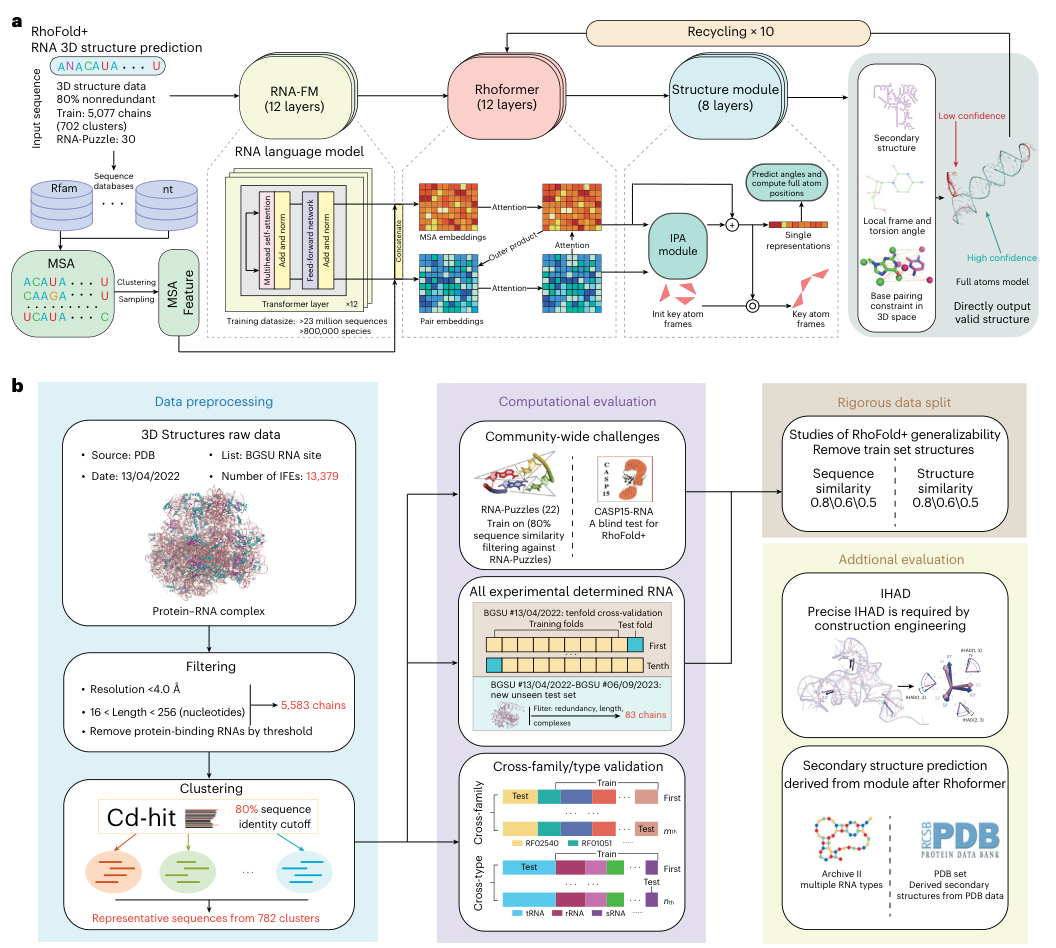
Figure 1. (a) RhoFold+ architecture: two inputs, RNA-FM and the MSA, are fused by the Rhoformer, after which the structure module (IPA) outputs the all-atom structure; the whole network is recycled 10 times. (b) The data preprocessing pipeline, and the test suite made up of community challenges, all experimental structures, cross-family/cross-type validation, strict data splits and additional evaluations.
How to read this figure
- Panel a reads from left to right. At the lower left is the MSA pathway: homologous sequences are retrieved from databases such as Rfam and nt, then clustered or subsampled to produce MSA features. At the top is RNA-FM (12 layers); its output is concatenated with the MSA embedding and fed into the Rhoformer (12 layers), which repeatedly exchanges information between the MSA embedding and the pair embedding via attention and outer products. The structure module (8 layers) then starts from initialized key-atom frames, updates the frames with IPA, predicts torsion angles and computes all-atom positions.
The gray area on the far right shows the outputs: secondary structure, local frames and torsion angles, base-pairing constraints in 3D space, and an all-atom model colored by confidence (red for low confidence, cyan for high confidence). The ‘Recycling × 10’ arrow at the top indicates that the structure is fed back into the Rhoformer for iterative refinement.
- Panel b has three columns. The left column is data preprocessing: raw PDB structures → filtering to 5,583 chains → clustering at 80% sequence identity into 782 clusters. The middle column is the computational evaluation: community challenges, ten-fold cross-validation on all experimental structures and a blind test on new structures, and cross-family/cross-type validation. The right column covers strict splits that remove training structures by sequence similarity and by structural similarity (three thresholds: 0.8/0.6/0.5), plus two additional evaluations, IHAD and secondary structure.
Figure 1b reflects how carefully the paper’s evaluation was designed. RNA structural data are scarce and members of the same family are highly similar to each other, so random splits can easily overestimate a model. The authors therefore designed a series of progressively harder tests:
1. Community challenges: for the RNA-Puzzles evaluation, structures with more than 80% sequence similarity to each target were removed from the training set beforehand; CASP15 served as a retrospective blind test.
2. Ten-fold cross-validation: the 782 sequence clusters were split into 10 folds; each time about 80 clusters were held out for validation and the remaining 702 clusters were used for training, rotating 10 times to check whether the results depend on any particular split.
3. Time-split blind test: structures added to BGSU between 2022-04-13 and 2023-09-06 were taken as the test set after redundancy removal and length and complex filtering. These structures had not been released at training time, making this the closest to a real-world use case.
4. Cross-family and cross-type: when testing a given Rfam family (or an RNA type such as tRNA, rRNA or sRNA), all structures of that family (type) were removed from the training set, amounting to a ‘domain shift’.
5. Structural similarity filtering: in addition to sequence similarity, training structures structurally similar to the test target were removed using TM-score thresholds. Training samples that do not look alike in sequence but are highly similar in structure were also removed.
These five kinds of tests become progressively harder, all serving a single purpose: to show that RhoFold+ has learned transferable folding principles rather than taking shortcuts by memorizing the training set.
Figure 2: RNA-Puzzles and CASP15 benchmarks
What this figure asks: How accurate are RhoFold+ predictions on the RNA-Puzzles and CASP15 benchmarks?
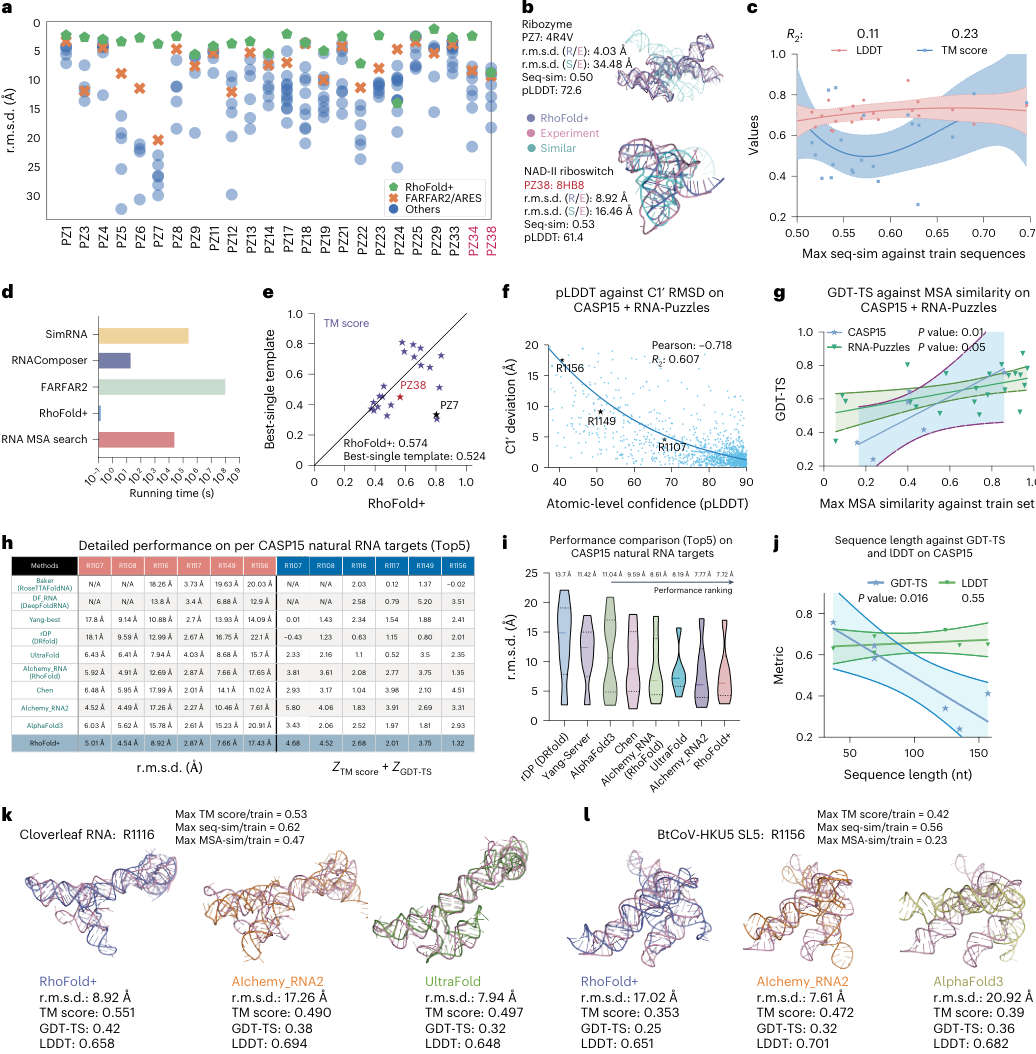
Figure 2. Benchmarking RhoFold+ on community challenges. (a) r.m.s.d. on 24 RNA-Puzzles targets; (b) structural superpositions of PZ7/PZ38; (c) regression of accuracy against sequence similarity to the training set; (d) running time; (e) comparison with the TM-score of the best single template; (f) pLDDT versus C1′ deviation; (g) GDT-TS versus MSA similarity; (h) per-target performance on CASP15 natural RNAs; (i-j) performance ranking and its relationship to sequence length; (k-l) structural examples of R1116 and R1156.
Panel a: Leading on almost all 24 targets
The horizontal axis lists 24 nonredundant single-chain RNA-Puzzles targets and the vertical axis is r.m.s.d.; note that the vertical axis is inverted, so higher points mean smaller errors. Each point is one model submitted by a method: green pentagons are RhoFold+, orange crosses are FARFAR2/ARES and blue dots are other methods. PZ34 and PZ38, marked in red, were released after RhoFold+ was developed, making them two genuine blind tests.
The green pentagons sit at the top of almost every column. In numbers: RhoFold+ achieves an average r.m.s.d. of 4.02 Å, versus 6.32 Å for the runner-up FARFAR2 (taking its top 1% of models), a gap of 2.30 Å; on more than half of the targets, RhoFold+ beats the runner-up by about 4 Å; 17 targets fall below 5 Å, and only 1 exceeds 10 Å. The average TM-score is 0.57, compared with 0.41 and 0.44 for the other top-performing methods.
The only clear exception is PZ24, a difficult target containing a complex pseudoknot.
Panel b: The most similar sequence can have a completely different structure
Two case studies superimpose three structures: purple is the RhoFold+ prediction, pink is the experimental structure, and cyan is the structure of the training-set RNA whose sequence is most similar to the target. In the figure, R/E denotes the deviation between RhoFold+ and the experimental structure, and S/E denotes the deviation between the most similar training structure and the experimental structure.
PZ7 (PDB 4R4V, a 186-nt Varkud satellite ribozyme): R/E is 4.03 Å, while S/E is as high as 34.48 Å, with a sequence similarity of 0.50 and a pLDDT of 72.6.
PZ38 (PDB 8HB8, an NAD-II riboswitch): this is the target with the highest sequence similarity to the training set among all targets (53%), yet the most similar training structure still differs from the experimental structure by 16.46 Å; RhoFold+’s 8.92 Å is not perfect, but it is clearly better, with a pLDDT of 61.4.
The conclusion is straightforward: copying the structure of the most similar sequence leads to large errors, and RhoFold+’s predictions are far more accurate than such ‘nearest-neighbor retrieval’.
Panel c: Performance is only weakly correlated with training-set similarity
The horizontal axis is each target’s maximum sequence similarity to the training set, and the vertical axis shows TM-score (blue) and LDDT (pink). TM-score emphasizes global topology; LDDT is a superposition-free local metric that measures how well local distances between all atoms are preserved.
If the model relied mainly on memorization, targets more similar to the training set should score better. Such a correlation has been observed in protein structure prediction, but here the regression R² is only 0.23 (TM-score) and 0.11 (LDDT), from which the authors conclude that there is no significant correlation between model performance and training–test similarity.
Panel d: Orders of magnitude faster, but the MSA search must be counted
The horizontal axis is running time on a log scale. A typical RhoFold+ prediction takes about 0.14 seconds; reading off the tick marks, RNAComposer is on the order of 10 seconds, SimRNA on the order of 105 seconds, and FARFAR2 close to 108 seconds (the authors ran FARFAR2 on a single CPU core). These sampling methods are slow mainly because they perform large-scale conformational sampling.
The figure also includes a separate bar for ‘RNA MSA search’, falling between 104 and 105 seconds. In other words, the 0.14 seconds refers to neural network inference alone; if the MSA has to be searched from scratch, most of the pipeline’s time is spent searching databases. What RhoFold+ eliminates is the 3D conformational sampling step; the preprocessing cost remains.
Panel e: Beating the ‘best single template’
This comparison is about structural similarity. For each target, the most structurally similar model in the training set is taken as the ‘best single template’; the horizontal axis is the TM-score of the RhoFold+ prediction and the vertical axis is the TM-score of the best template. Points below and to the right of the diagonal indicate that RhoFold+ is more accurate than even the best template.
Most targets fall below and to the right of the diagonal; a few targets (concentrated around a template TM-score of 0.7–0.8) are better served by the best template. On average, RhoFold+ reaches a TM-score of 0.574 versus 0.524 for the best single template, 0.05 higher. The authors specifically note that in the protein field, computational methods first surpassed the best single template only at CASP14, which was regarded at the time as a substantial breakthrough.
Panel f: pLDDT is a trustworthy confidence measure
Plotting the atom-level pLDDT of all RNA-Puzzles and CASP15 targets against the C1′ atom deviation reveals a clear negative correlation, Pearson r = −0.718, R² = 0.607. Regions with high pLDDT have small errors, while low-pLDDT regions are more likely to be wrong. R1156, marked in the figure, sits in the upper left corner (pLDDT about 40, deviation about 17 Å); it is the failure case discussed later. For users, this means low-pLDDT regions can be used to pinpoint the parts that most need experimental validation.
Panel g: What really drives accuracy is MSA similarity
Here the horizontal axis becomes the maximum similarity between the query RNA’s MSA profile and the training-set MSAs, and the vertical axis is GDT-TS. Both CASP15 (P = 0.01) and RNA-Puzzles (P = 0.05) show positive correlations. Taking c and g together: whether a single sequence resembles the training set has limited explanatory power; whether the evolutionary pattern captured by the whole MSA resembles what was seen in training has a more significant effect on prediction quality. In other words, the model’s generalization has little to do with sequence memorization, but it depends heavily on high-quality evolutionary information.
Figure 3: Generalizing to unseen structures, types and families
What this figure asks: Is RhoFold+ still accurate on RNAs solved after the training cutoff, and under stringent tests in which entire types or families are removed?
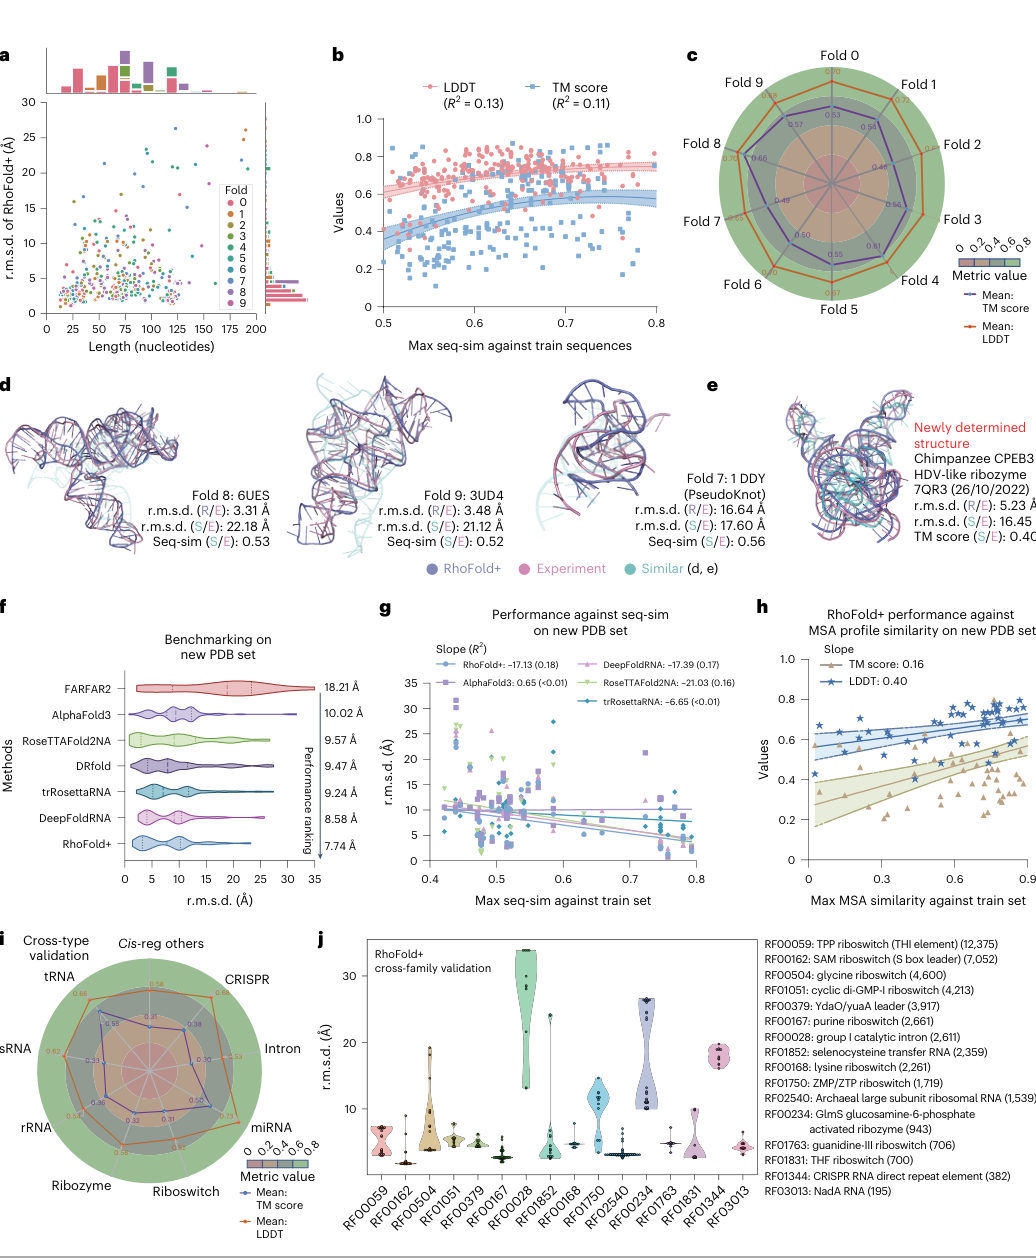
Figure 3. Benchmarking on all experimentally determined RNAs. (a) Error versus length/fold class. (b-c) Regression of accuracy against training-set similarity. (d-e) Structural examples from the new PDB blind test. (f) r.m.s.d. comparison with each method. (g-h) Relationship with sequence/MSA similarity. (i) Cross-type radar chart. (j) Cross-family validation.
New PDB blind test (76 single-chain RNAs solved after the training cutoff): RhoFold+ achieves an average r.m.s.d. of 7.74 Å, about 2.2 Å lower than AlphaFold3, and also outperforms DeepFoldRNA, trRosettaRNA, DRfold, RoseTTAFold2NA and FARFAR2; the models built for complexes actually perform worse when applied to single-chain RNA.
- Panel g (cross-family/cross-type radar): when an entire Rfam family or RNA class (tRNA, rRNA and so on) is removed from the training set before testing, which amounts to a domain shift, the average cross-family r.m.s.d. is still 6.69 Å. Together with the weak correlations in b/c (R² 0.11–0.23), this indicates that the model has learned transferable folding principles rather than memorizing the training set.
Figure 4: Beyond 3D: secondary structure and substructures
What this figure asks: Beyond 3D coordinates, can RhoFold+ also predict secondary structure well along the way?
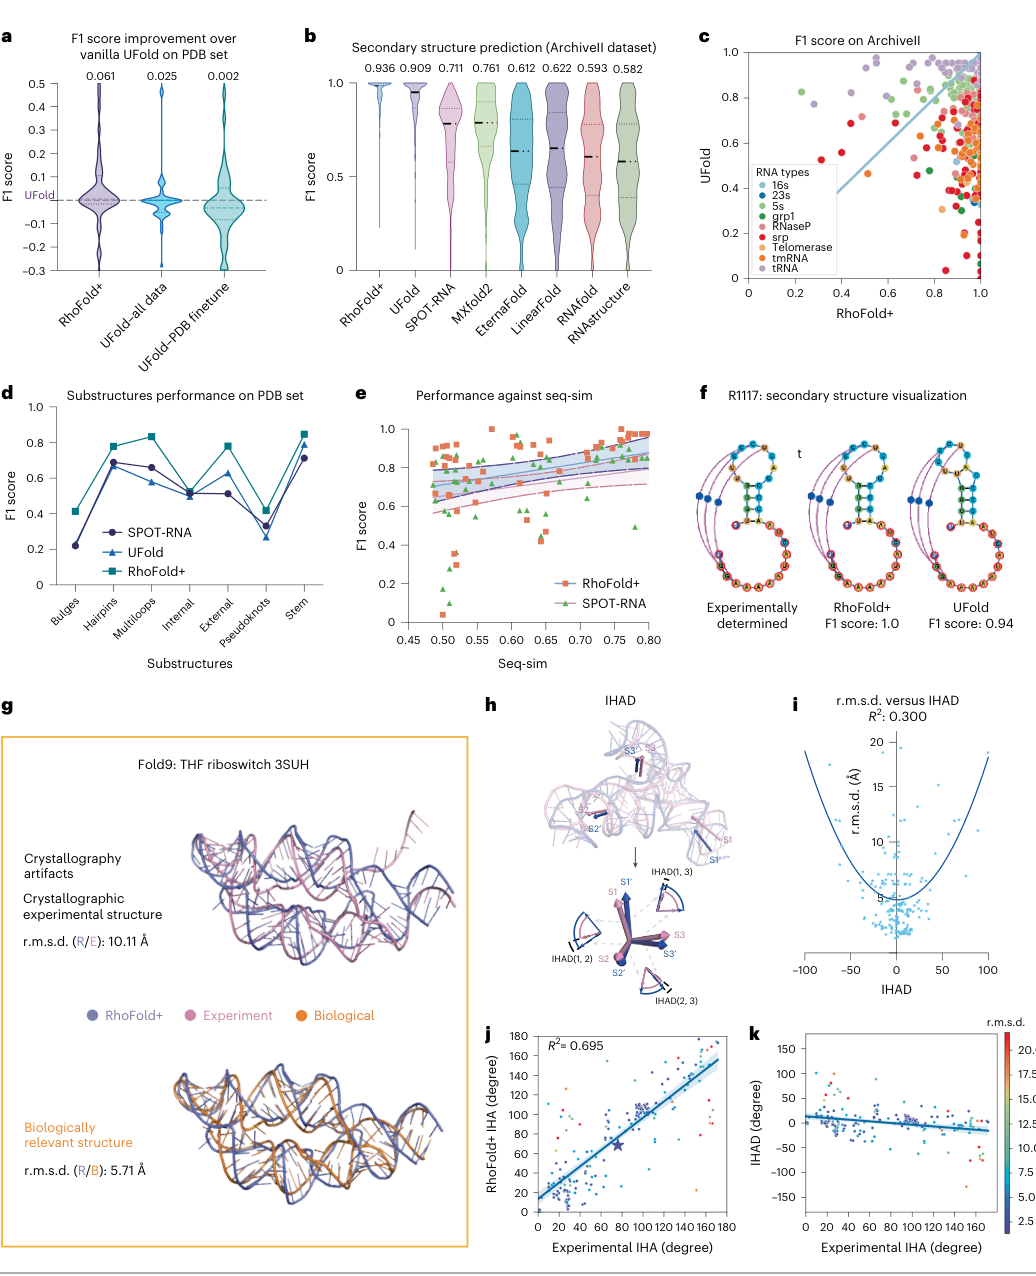
Figure 4. RhoFold+ accurately predicts secondary structures and substructures. (a) F1 improvement over UFold on the PDB set. (b) F1 of each method on ArchiveII. (c) F1 by RNA type. (d) F1 for each kind of substructure. (e) F1 versus seq-sim. (f) Visualization of the R1117 secondary structure. (g-k) Structural examples and IHAD analysis.
RhoFold+ predicts secondary structure using the Rhoformer’s attention maps plus a postprocessing module. Panel b: on ArchiveII, F1 is 0.936, higher than UFold’s 0.909 and SPOT-RNA’s 0.711, among others; the advantage is more pronounced for larger RNA types. Panel f: for the R1117 secondary structure, RhoFold+ reaches an F1 of 1.0 (UFold 0.94). This shows that the model does more than output 3D coordinates; it also produces rich representations that support state-of-the-art secondary structure prediction.
Figure 5: Ablations: where does the performance actually come from?
What this figure asks: How much do the MSA, RNA-FM, recycling and self-distillation each contribute? Can multiple samples yield better structures?
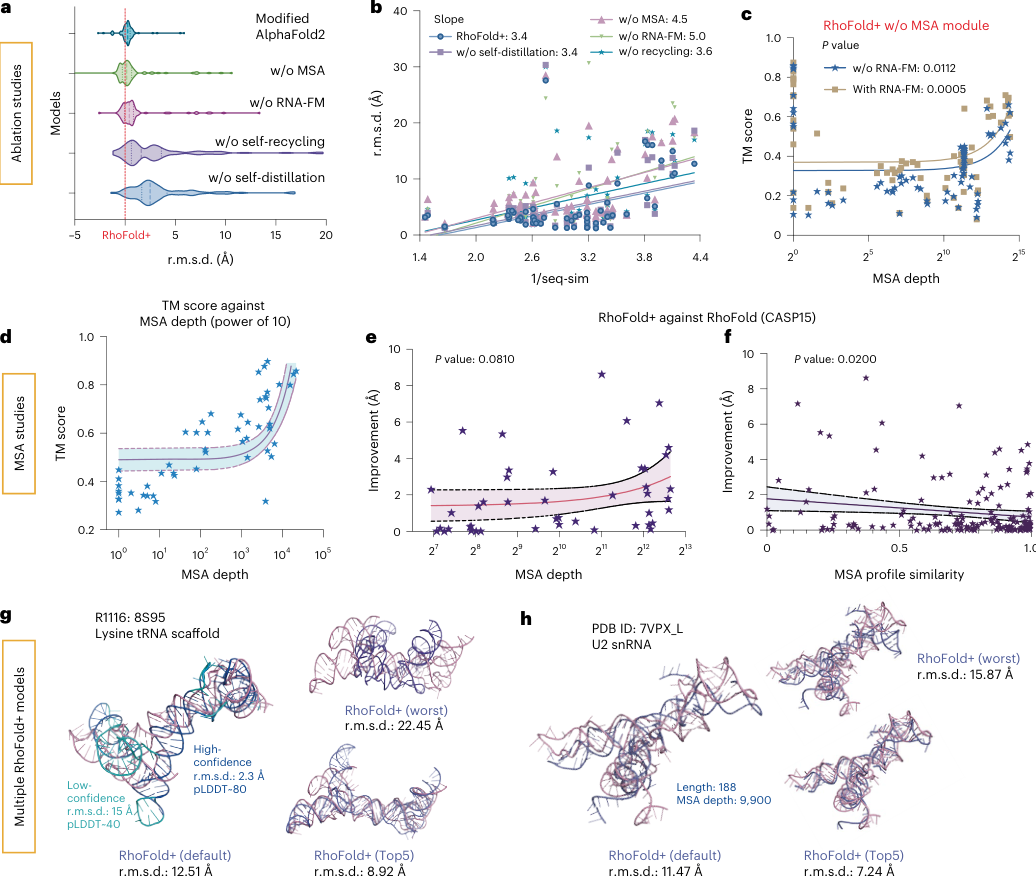
Figure 5. Ablation studies and multi-model sampling. (a) r.m.s.d. distributions after removing each module. (b) Slope of error versus sequence similarity. (c) TM-score versus MSA depth with and without RNA-FM. (d) TM-score versus MSA depth. (e-f) Improvement over the earlier RhoFold. (g-h) Best/worst/default/Top5 models from multiple samples.
- Panel a/b: Removing any module worsens r.m.s.d. After MSA removal, the error increase slope with increasing sequence divergence is 4.5; removing RNA-FM yields a steeper slope of 5.0, indicating that when targets are unfamiliar and MSA is missing, RNA-FM compensation is most critical. Panel c/d: With MSA depth exceeding ~100 sequences and profile closer to the training set, TM-score is higher.
- Panels g/h: when multiple models are sampled for the same target, the gap between the best and worst is large (for example, 2.3 Å vs 22.45 Å for R1116); the default model is at 12.51 Å, and an 8.92 Å model can be picked from the Top5. This shows that sampling plus ranking by pLDDT can bring further gains, consistent with the negative correlation between pLDDT and error shown earlier.
Part 4: Key Contributions
Finding 1: Single-chain RNA 3D structure prediction reaches a new level of accuracy
The average r.m.s.d. is 4.02 Å on RNA-Puzzles, with 17/24 targets below 5 Å; on CASP15 natural RNA targets the average is 7.72 Å, a fully automated system matching the expert-guided winning group; on the new PDB set the average is 7.74 Å, better than DeepFoldRNA, trRosettaRNA, DRfold, RoseTTAFold2NA, AlphaFold3 and FARFAR2.
Finding 2: The model does not take shortcuts by memorizing the training set
Performance is only weakly correlated with sequence similarity to the training set (R² 0.11–0.23); on RNA-Puzzles, it outperforms the best single template in the training set on average (TM-score 0.574 vs 0.524); it maintains usable accuracy in ten-fold cross-validation, time-split, cross-type and cross-family tests, with an average cross-family r.m.s.d. of 6.69 Å.
Finding 3: The language model and the MSA are complementary
MSA makes substantial contributions: as the MSA profile becomes more similar to the training set and the depth exceeds approximately 100 sequences, the results improve; RNA-FM provides compensation when the target is unfamiliar and MSA is absent, and removing it causes error to increase most steeply with sequence divergence. Combining both achieves optimal performance.
Finding 4: The failure modes are highly consistent
From R1116 and R1156 to long sequences and cross-family tests, the most common error is that local helices are predicted correctly while the orientation and stacking between helices are wrong. GDT-TS and TM-score are sensitive to length and MSA similarity, whereas LDDT stays relatively stable, which statistically corroborates this.
Finding 5: One model, multiple verifiable outputs
Rhoformer’s internal representations can directly perform secondary structure prediction (F1 0.936 on ArchiveII); pLDDT correlates strongly with actual error (r = −0.718); the predicted inter-helix angles are in high agreement with experimental values; the model may also help identify crystallographic artifacts. These outputs can all be validated with experimental data.
Part 5: Limitations and Outlook
Why this work matters
1. A workable solution to the ‘few structures, many sequences’ problem. RNA is the class of biological macromolecule with the scarcest structural data. RhoFold+ combines more than twenty million unlabeled sequences, over twenty thousand sequences with secondary structure annotations and a few thousand experimental structures; through language model pretraining, self-distillation and rigorous data curation, it finds an effective training path across these three kinds of data. This approach is also instructive for other data-scarce structural problems.
2. Fully automated and reproducible. The best-performing RNA structure prediction approaches have often depended on expert intervention. RhoFold+ matches the expert group on CASP15 natural targets while releasing its weights and inference code as open source and offering an online server, so that researchers without a structural biology background can use it directly.
3. An evaluation design worth emulating. Community challenges, ten-fold cross-validation, time splits, cross-type and cross-family tests, and dual filtering by sequence and structural similarity: this full suite of tests says more about generalization than a simple random split, and it gives future RNA structure prediction work a reference evaluation framework.
4. How it can be used in practice. Providing initial 3D models for unknown RNAs; helping interpret secondary structure data from chemical probing; using predicted interhelical angles to assist cryo-EM and NMR construct design and RNA nanostructure design; supplying starting conformations for molecular dynamics simulations; and using low-pLDDT regions to identify the positions that most need experimental validation.
A few cautions for users
- The 0.14 seconds is neural network inference time; searching for an MSA from scratch takes several orders of magnitude longer. The speed advantage is greatest when an MSA already exists or the same sequence needs to be predicted repeatedly.
- The CASP15 results are the best of 5 candidates. In practice, do not rely on a single model; check the global and per-nucleotide pLDDT, whether results from multiple MSA samples agree, whether the secondary structure is reasonable and whether the interhelical angles are stable.
- RhoFold+ outperforms AlphaFold3 on single-chain RNA benchmarks, but the two serve different purposes: AlphaFold3 is aimed at general prediction of proteins, nucleic acids, ligands and their complexes. These results do not imply that RhoFold+ is stronger than AlphaFold3 overall.
Limitations to keep in mind
In the discussion, the authors candidly list limitations that RhoFold+ shares with similar deep learning methods:
The output is a single static conformation. Our understanding of RNA structural diversity is still very limited, and the same molecule may adopt multiple conformations because of its dynamics and its interactions with other molecules. Junctions are a typical example and are better described by dynamic conformational ensembles. RhoFold+ struggles to represent processes such as conformational exchange and ligand-induced folding.
Large, complex RNAs remain difficult. Because of insufficient data, large structures with multiple helices and pseudoknots are still hard to predict, especially sequences longer than 500 nt. The training data in this paper also only cover lengths up to about 256 nt.
Complexes are not covered. Complexes of RNA with ligands and proteins pose additional challenges. AlphaFold3 and RoseTTAFoldNA can predict RNA complexes, but their accuracy is still limited, and on single-chain RNA they also fall short of RhoFold+. The difficulties with introns and CRISPR elements in the cross-family tests stem partly from ignoring their interactions with proteins in vivo.
Environmental conditions are simplified. The training data come from specific experimental conditions and may not generalize to the variable solution environment in vivo. Ion concentrations such as magnesium and potassium, as well as the presence of ligands, are critical to RNA folding and stability, yet every evaluation in this paper takes only the sequence as input.
Peak performance depends on the MSA. The title emphasizes the language model, but the ablations show that the MSA is the most critical component. For sequences lacking MSAs, such as designed RNAs and orphan RNAs, accurate prediction remains difficult; RNA-FM mitigates this dependence but does not eliminate it. The designed targets excluded from CASP15 belong precisely to this category.
The improvement directions proposed by the authors include: using secondary structures determined by experimental methods such as chemical probing as constraints; combining molecular dynamics and energy functions; improving the MSA extraction pipeline; and integrating with protein structure prediction tools such as RoseTTAFoldNA and AlphaFold3 to handle RNA–protein and RNA–ligand interactions. Overall, RhoFold+ clearly advances single-chain RNA structure prediction, but RNA 3D structure prediction as a whole remains an open problem.
About the Corresponding Authors
This paper has six corresponding authors. Yu Li is faculty in the Department of Computer Science and Engineering at the Chinese University of Hong Kong, received his undergraduate degree from the University of Science and Technology of China, earned his PhD from King Abdullah University of Science and Technology (KAUST), with research interests at the intersection of machine learning and bioinformatics; the RNA-FM language model underlying RhoFold+ also originates from his team. Siqi Sun is a junior researcher at Fudan University and PhD from the Toyota Technological Institute at Chicago, with research interests including deep learning and computational biology. Di Liu is an assistant professor at the School of Molecular Sciences at Arizona State University, USA, received his undergraduate degree from Nanjing University and PhD from the University of Chicago, researching RNA nanostructure self-assembly and cryo-electron microscopy-based RNA structure determination. Sheng Wang is a co-founder of Shanghai Zhiyu Biotech Co., Ltd., received his undergraduate degree from Shanghai Jiao Tong University and PhD from the Institute of Theoretical Physics, Chinese Academy of Sciences, engaged in deep learning-driven protein structure prediction and synthetic biology research. Peng Yin is a professor in the Department of Systems Biology at Harvard Medical School and core faculty member of the Wyss Institute, received his undergraduate degree from Peking University and PhD from Duke University, with research focused on the construction and imaging of DNA/RNA nanostructures. James J. Collins is the MIT Termeer Chair Professor, Rhodes Scholar and PhD from Oxford University, one of the founders of synthetic biology, and this study is also part of the Antibiotics-AI Project he leads.
Citation
Shen, T., Hu, Z., Sun, S., Liu, D., Wong, F., Wang, J., … & Li, Y. (2024). Accurate RNA 3D structure prediction using a language model-based deep learning approach. Nature Methods, 21(12), 2287-2298. https://doi.org/10.1038/s41592-024-02487-0